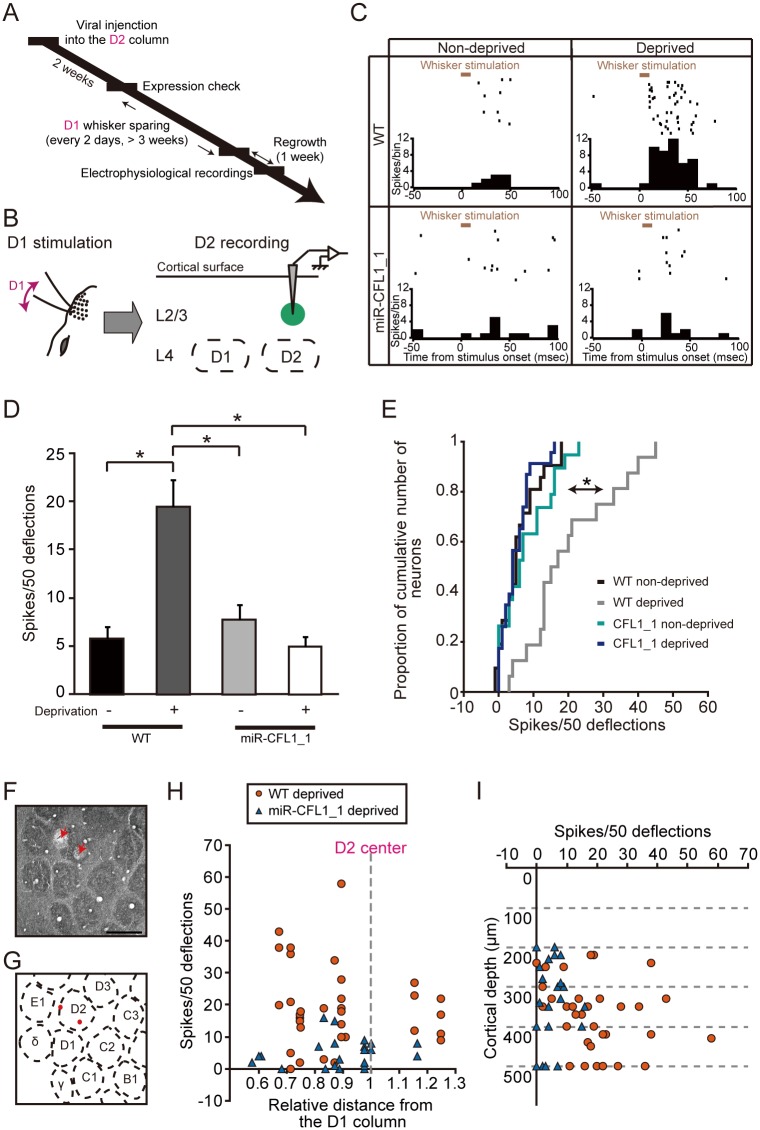
Fig 3. Effects of CFL1 KD on D2 neuronal responses to spared D1 inputs.
(A) Experimental time course of virus injection, whisker sparing, and electrophysiological recordings. (B) Optogenetically labeled CFL1 KD neurons in L2/3 of the D2 barrel column were recorded while the D1 whisker was stimulated. (C) Example raster plots (50 trials are shown in horizontal row) and peristimulus time histograms (PSTHs) (averaged across all trials) of single neurons recorded in WT non-deprived, WT deprived, miR-CFL1_1 non-deprived, and miR-CFL1_1 deprived rat, respectively. (D) Average number of spikes measured in response to D1 whisker stimulation in D2 column L2/3 neurons for each rat group. n = 21, 33, 19 and 23 units for WT non-deprived, WT deprived, miR-CFL1_1 non-deprived and miR-CFL1_1 deprived groups, respectively. WT non-deprived, p = 2.7 × 10⁻⁶; miR-CFL1_1 non-deprived, p = 1.1 × 10⁻⁴; miR-CFL1_1 deprived, p = 3.3 × 10⁻⁷ versus WT deprived group, Tukey-Kramer’s multiple comparison test. (E) Cumulative frequency histogram of spike number. WT non-deprived, p = 2.0 × 10⁻⁴; miR-CFL1_1 non-deprived, p = 0.028; miR-CFL1_1 deprived, p = 1.8 × 10⁻⁶ versus WT deprived group, Kolmogorov-Smirnov test with Bonferroni’s correction. (F) A representative tangential section of cortical L4 in which two electrolytic lesions were made (indicated with red arrows). Scale bar, 500 μm. (G) A schematic diagram of the barrel pattern. Both lesion marks were within the D2 barrel column. (H, I) Distribution of average spike number in response to D1 whisker stimulation versus distance from the D1 column center (H) or cortical depth (I) for neurons obtained from WT and miR-CFL1_1 deprived rats.

