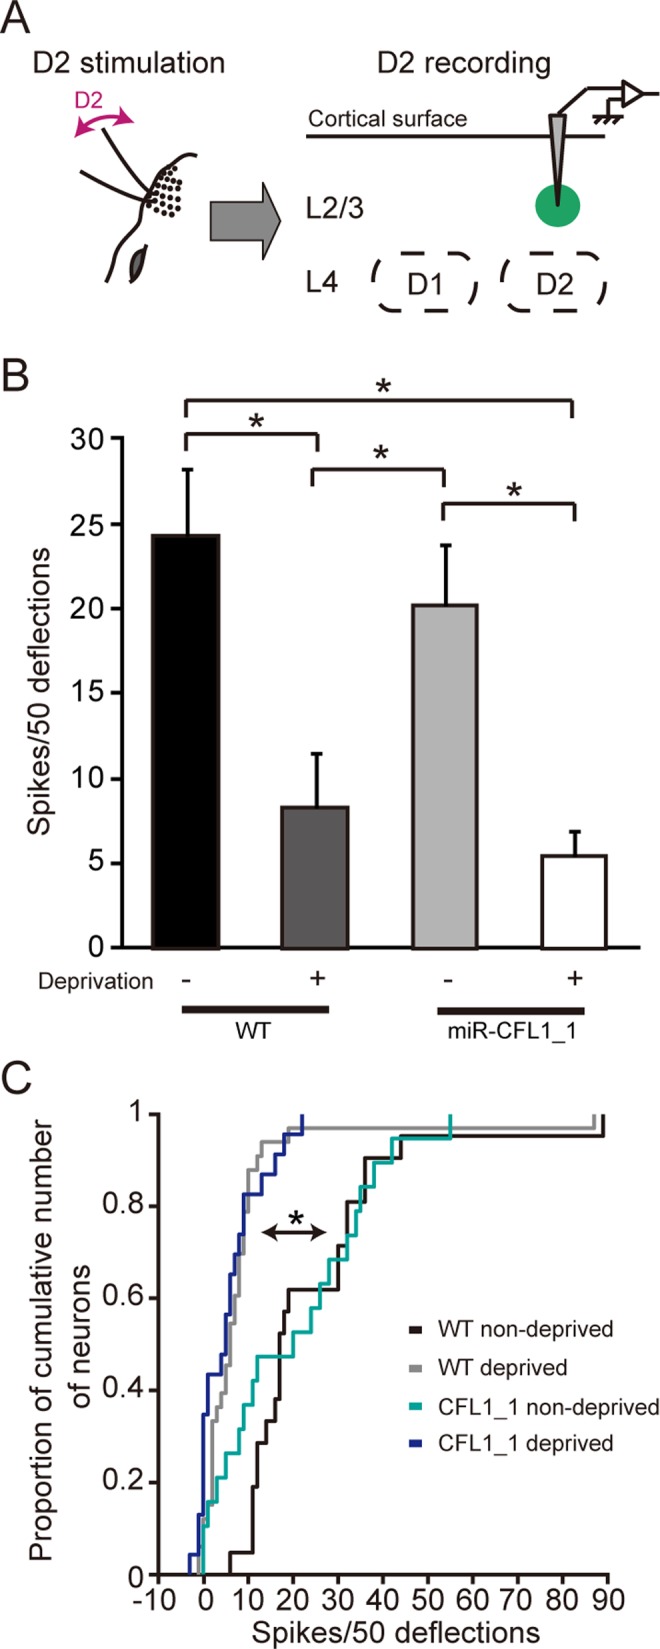
Fig 5. Effects of CFL1 KD on D2 neuronal responses to deprived D2 inputs.

(A) Optogenetically labeled CFL1 KD neurons in L2/3 of the D2 barrel column were recorded while the D2 whisker was stimulated. (B) Average number of spikes measured in response to D2 whisker stimulation in D2 column L2/3 neurons for each rat group. n = 21, 33, 19, and 23 units for WT non-deprived, WT deprived, miR-CFL1_1 non-deprived, and miR-CFL1_1 deprived groups, respectively. WT non-deprived, p = 0.0009; miR-CFL1_1 non-deprived, p = 0.028 versus WT deprived group. WT non-deprived, p = 0.00025; miR-CFL1_1 non-deprived, p = 0.0082 versus miR-CFL1_1 deprived group, Tukey-Kramer’s multiple comparison test. (C) Cumulative frequency histogram of spike number. WT non-deprived, p = 5.2 × 10⁻⁸; miR-CFL1_1 non-deprived, p = 0.013 versus WT deprived group. WT non-deprived, p = 5.7 × 10⁻⁶; miR-CFL1_1 non-deprived, p = 0.058 versus miR-CFL1_1 deprived group, Kolmogorov-Smirnov test with Bonferroni’s correction.
