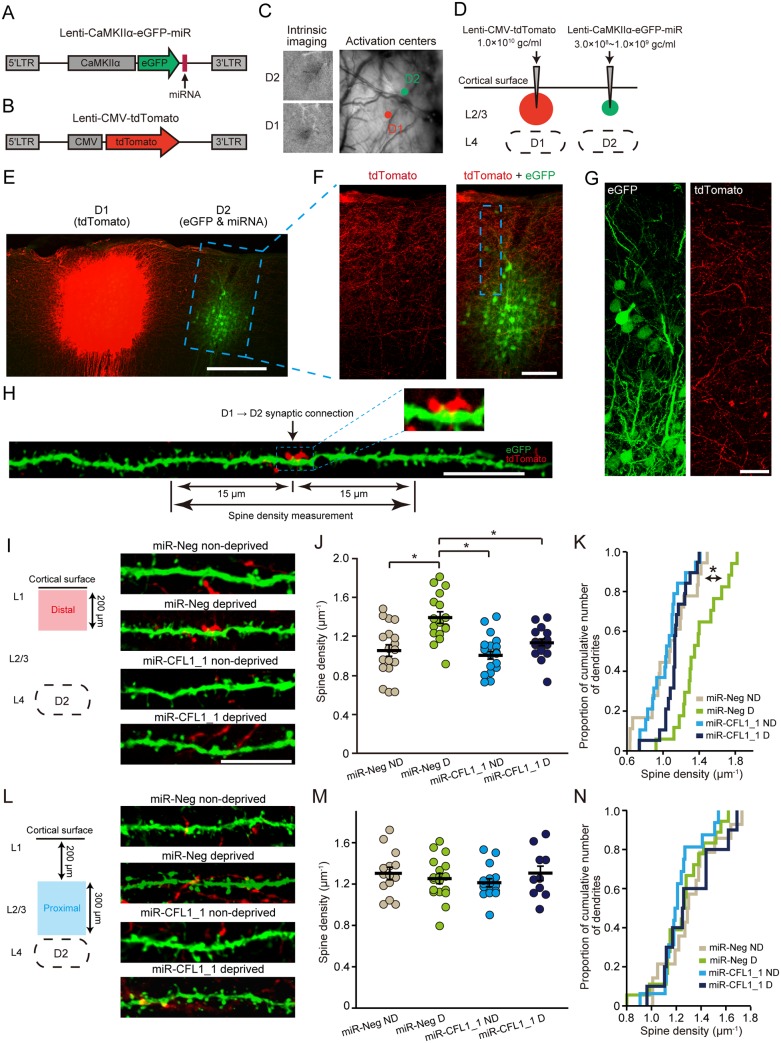
Fig 6. Effects of CFL1 KD on spine density during sensory deprivation.
(A, B) Lentiviral vectors employed for co-expressing eGFP and miRNAs (A) and for expressing tdTomato (B). (C) The D1 and D2 barrel columns were identified via intrinsic signal optical imaging. (D) Virus injection was targeted to L2/3 of the D1 and D2 columns. (E) A representative parasagittal section showing expression of tdTomato (D1) and eGFP (D2). Scale bar, 300 μm. (F) Magnified view of an eGFP-expressing region in the parasagittal section shown in (E). Scale bar, 100 μm. (G) Confocal images of a rectangle region shown in (F). Scale bar, 20 μm. (H) A representative dendritic branch in the D2 column is shown that made a putative synaptic connection with a tdTomato+ D1 axonal bouton. Dendritic spines were counted that were localized at a distance less than 15 μm from an identified putative synaptic connection. A magnified view of the putative synaptic connection is shown in the inset. Scale bar, 10 μm. (I) Representative images of the dendritic branches within the distal portion in the D2 column. Scale bar, 10 μm. (J) Spine densities measured in the distal portion. n = 18, 17, 19, and 19 branch segments for miR-Neg non-deprived (ND), miR-Neg deprived (D), miR-CFL1_1 ND, and miR-CFL1_1 D groups, respectively. WT ND, p = 1.1 × 10⁻⁴; miR-CFL1_1 ND, p = 1.8 × 10⁻⁵; miR-CFL1_1 D, p = 0.0027 versus WT D group, Tukey-Kramer’s multiple comparison test. (K) Cumulative frequency histogram of spine density. WT ND, p = 0.037; miR-CFL1_1 ND, p = 3.6 × 10⁻⁴; miR-CFL1_1 D, p = 3.6 × 10⁻⁴ versus WT D group, Kolmogorov-Smirnov test with Bonferroni’s correction. (L−N) Same as (I−K) but of dendritic branches measured within the proximal portion. n = 14, 18, 16, and 10 branch segments for miR-Neg ND, miR-Neg D, miR-CFL1_1 ND, and miR-CFL1_1 D groups, respectively. WT ND, p = 0.86; miR-CFL1_1 ND, p = 0.97; miR-CFL1_1 D, p = 0.93 versus WT D group, Tukey-Kramer’s multiple comparison test.

