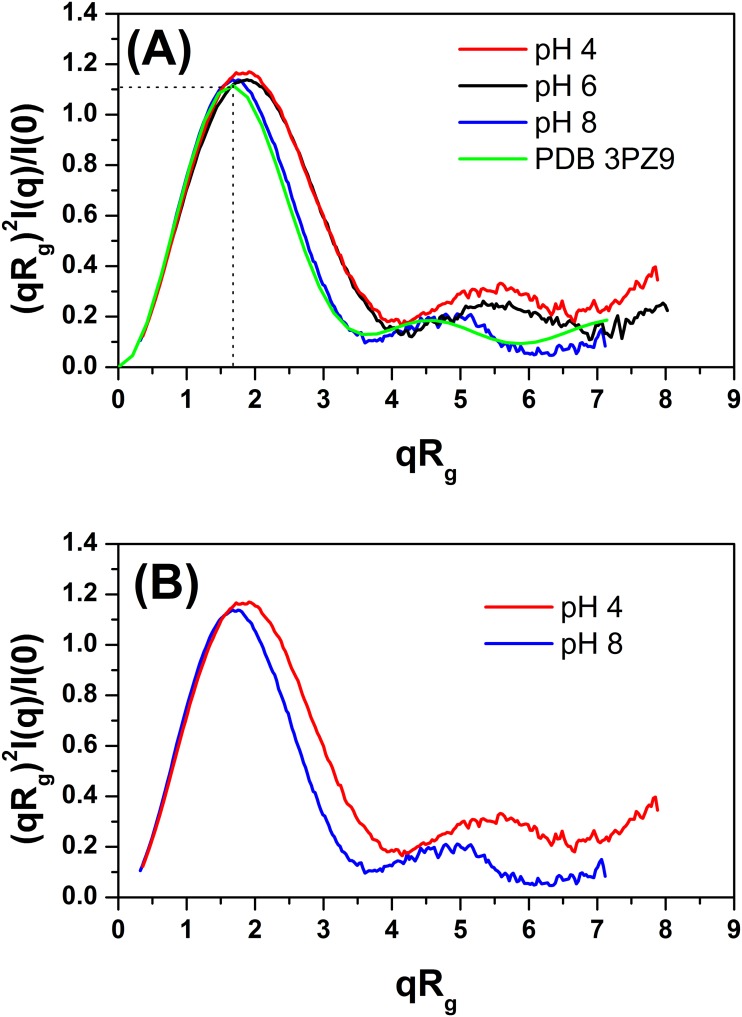
Fig 5. Dimensionless Kratky plots at 20°C and different pH values.
(A) Dimensionless Kratky plots generated from the SAXS data collected for TpManGH5 at pH 8 (solid blue line), 6 (solid black line) and 4 (solid red line). The solid green line represent the Kratky plot generated from the computed scattering curve based on the X-ray crystallographic structure of TpManGH5 (PDB 3PZ9). (B) Dimensionless Kratky plots generated from the SAXS data collected at pH 8 and 4 overlaid to make the differences between the curves.

