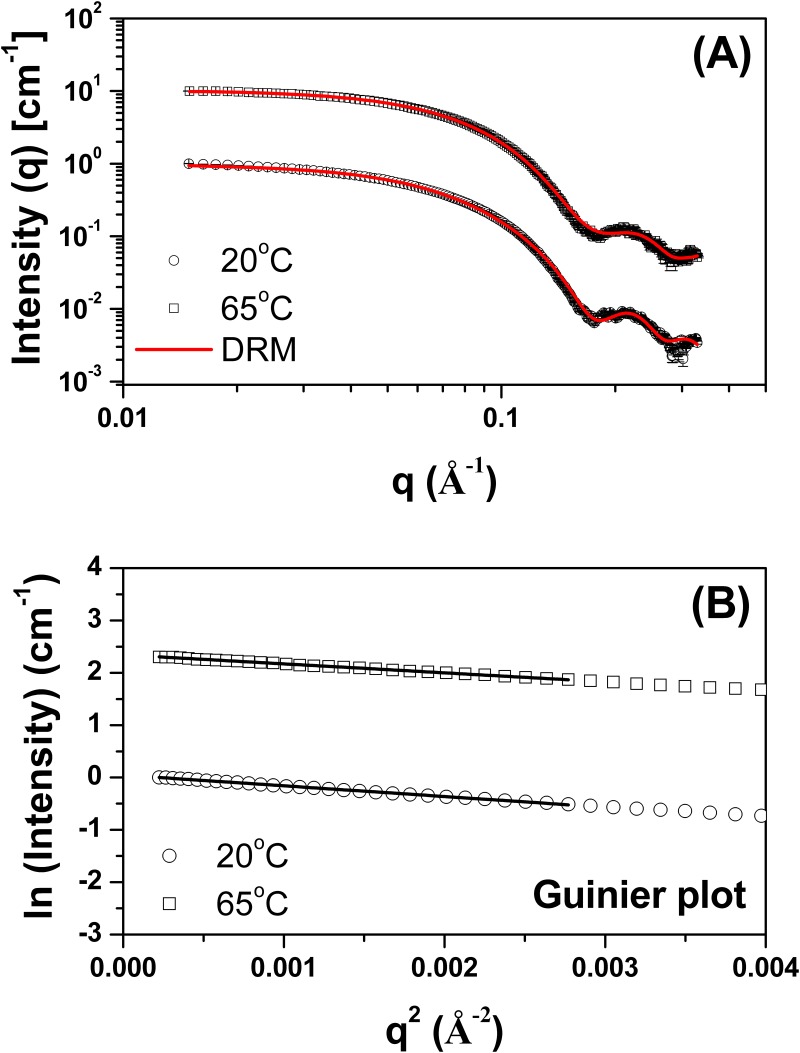
Fig 8. SAXS data collected for TpManGH5 at pH 6 and different temperatures.
(A) Experimental SAXS curves of the TpManGH5 at 20°C (open black circles with errors bars) and 65°C (open black squares with errors bars) superimposed on the computed scattering curves based on the restored low-resolution models (DRM, solid red lines). The curves have been offset for clarity. (B) Guinier plots (ln I versus q 2) for TpManGH5 at 20°C (open black circles) and 65°C (open black squares). The fit curves are the solid black lines. The curves have been offset for clarity.

