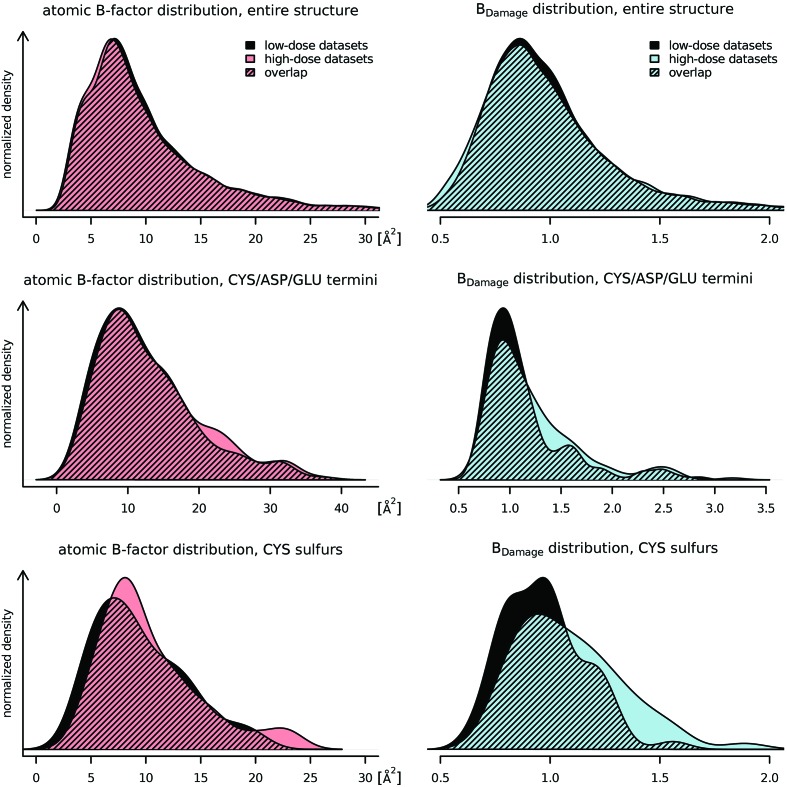
Figure 4.
The distributions of atomic B-factors (left) and the B Damage metric (right) for the low-dose (black) and high-dose (colour) datasets of the six proteins from Nanao et al. (2005 ▶) are given. All of the distributions are smoothed using a kernel density estimator (R Development Core Team, 2011 ▶). Top: the distribution for all non-hydrogen atoms (n = 7349) shows that both B-factor and B Damage have uni-modal slightly right-skewed distributions. B Damage has a mode below unity and by definition a fixed mean of 1. The differences between the low- and high-dose datasets are minimal: radiation damage causes the atomic B-factors to decrease, and the spread of B Damage to increase slightly. Middle: only B-factors and B Damage metrics of CYS Sγ, ASP Oδ and GLU O∊ atoms (n = 184) are shown. These atoms are at the end of residue side-chains known to be susceptible to specific radiation damage. Both the atomic B-factors and B Damage show higher values for the high-dose datasets. The change in B Damage is marked and separates specifically susceptible atoms from the bulk of the protein. Bottom: these distributions only show cysteine sulfurs (n = 58). The atomic B-factors tend to increase, but do not behave consistently. B Damage shows a consistent strong shift towards higher values, indicating that the B-factor of the sulfur atoms increases much faster than the B-factor of other atoms in similar packing densities.

