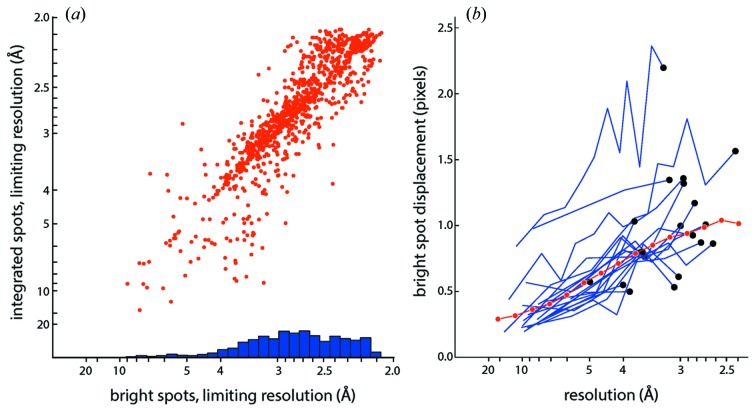
Figure 3.
Resolution limits and positional accuracy of the thermolysin integration model. (a) Limiting resolution for 1000 randomly selected shots from runs 21–27 of the L498 experiment, collected at a sample-to-detector distance of 171.0 mm, and thus restricted to 2.6 Å at the detector edge, and 2.05 Å in the detector corners. Data for the strongest-diffracting samples are therefore limited by a sharp cutoff due to detector geometry rather than the intrinsic sample diffraction. Horizontal axis: limits based on bright spots picked by a spotfinding algorithm (Zhang et al., 2006 ▶); blue bars represent a histogram of resolution limits determined with ‘method 2’ from that paper. Vertical axis: limits based on a Wilson plot of the integrated intensities. (b) Displacement (in pixels) between Bragg spot positions predicted by the lattice model used for integration, and the center of mass positions actually measured for bright spotfinder-picked spots. Blue traces: displacement for 20 randomly selected shots, with bright spots from each shot grouped into resolution bins; black dots identify the highest-resolution bin for each individual shot. Red curve: aggregate displacement over the 1000 images analyzed in panel (a).

