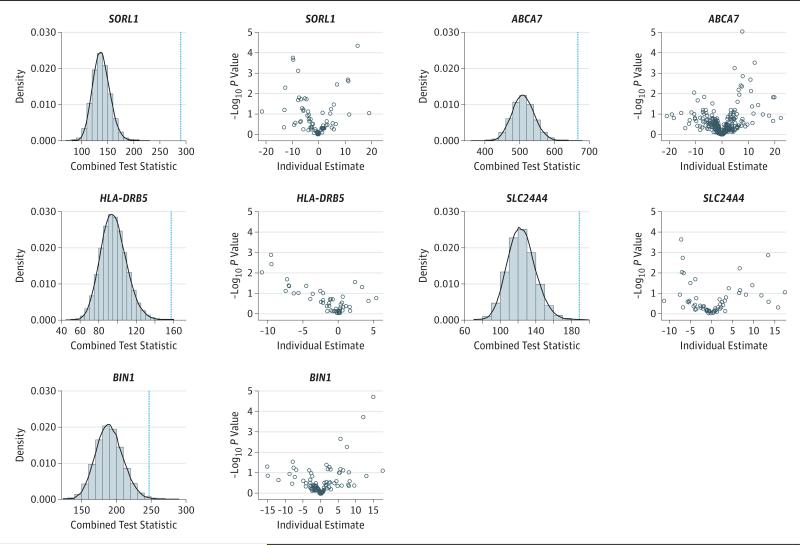
Figure 1. DNA Methylation With Pathological Alzheimer Disease Diagnosis in Associated Loci.
For each locus, the left panel shows the histogram and density function of the global test statistic generated from randomly permuted data, with a blue dashed line superimposed to represent the value of the same statistic observed from the actual data. The right panel is the volcano plot showing the significance level vs the regression estimates for individual CpG sites.

