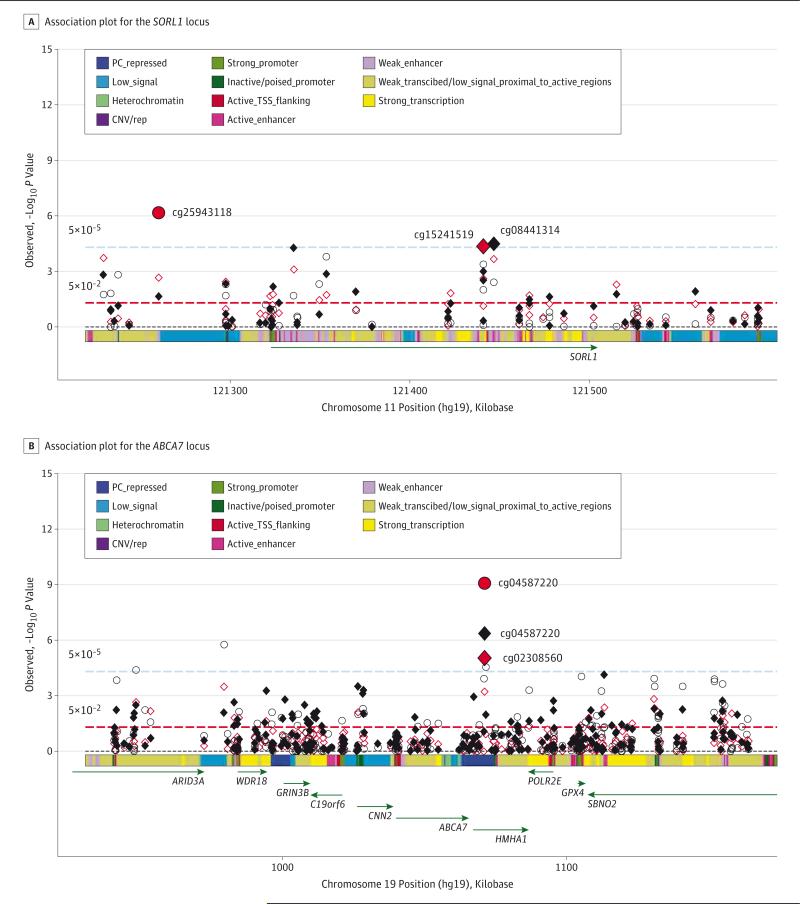
Figure 2. Association Plot for the SORL1 and ABCA7 Loci.
A, Association plot for the SORL1 locus. P values of individual CpG sites for each of the 3 Alzheimer disease pathological indexes (red diamond indicates pathological Alzheimer disease; black diamond, Aβ load; and red circle, tau tangle density) were plotted against their genomic positions. The color band on the x-axis represents the chromatic state of the region. The smallest P value for each outcome is highlighted with larger symbols. B, Association plot for the ABCA7 locus. CNV/rep indicates copy number variation/repetitive; PC, Polycomb; and TSS, transcription start site.

