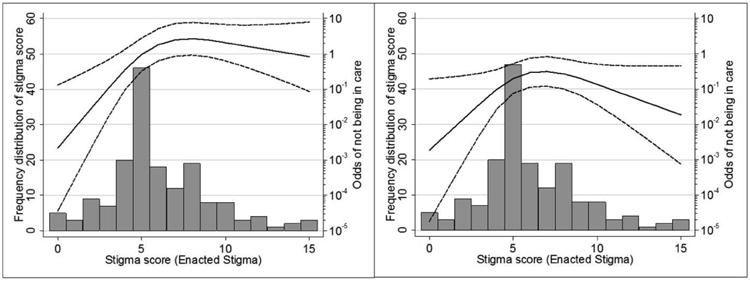
Figure 1.

Frequency distribution of enacted stigma scores and adjusted association with being out-of-care among HIV patients, Lima, Peru, 2011-2012, in the primary analysis (left panel) and re-classified analysis (right panel)a.
a Predicted odds (solid line) and 95% confidence interval (dashed line) for enacted stigma were obtained by fixing all other covariates at their median. Likelihood ratio test for linearity of the stigma term: primary analysis, p<0.001; re-classified analysis, p=0.006.
