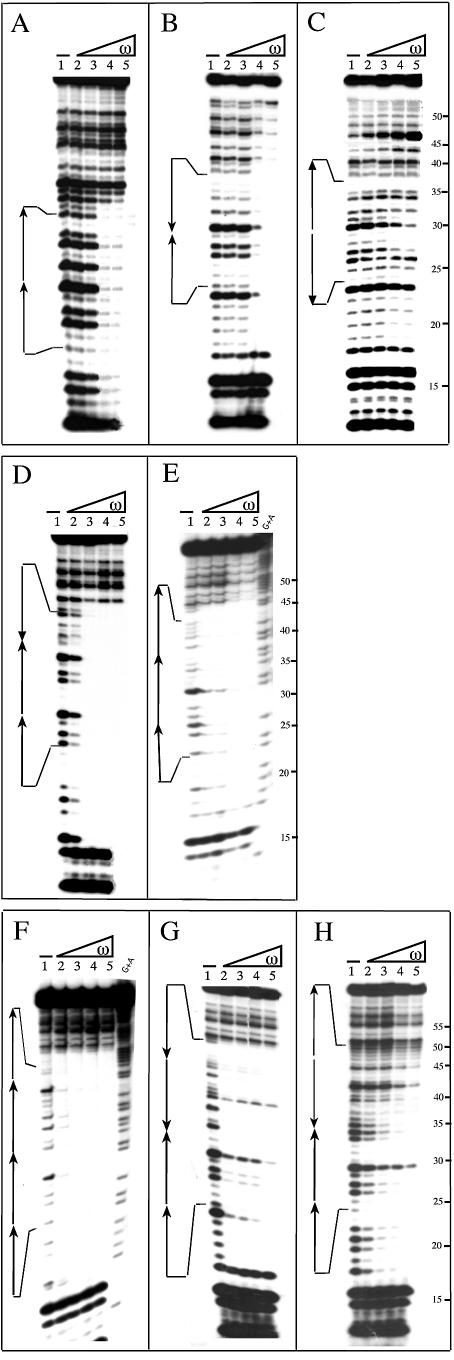
Figure 3.
DNase I footprinting experiments of ω2–DNA complexes. The [α-32P]HindIII–KpnI DNA fragments (bottom strand) described in Figure 2 (containing two to four heptads) were used. The number, location and orientation of the 7 bp repeats are indicated by arrows. [α-32P]DNA (2 nM) and 1 µg of poly [d(I-C)], as non-specific competitor DNA, were incubated with increasing concentrations of ω2 in buffer B for 15 min at 37°C, followed by limited digestion with DNase I. Except in (C), the ω2 concentrations were 8, 16, 32 and 64 nM (lanes 2–5, respectively). In (C) the ω2 concentrations were 32, 64, 128 and 256 nM. The symbol – in lane 1 indicates the absence of ω2. The G+A lanes at the right of (E) and (F) were obtained by chemical sequencing reaction (Maxam–Gilbert) and used as size standard. The numbers to the right of (C), (E) and (H) refer to nucleotide positions in the sequence of the studied DNA.

