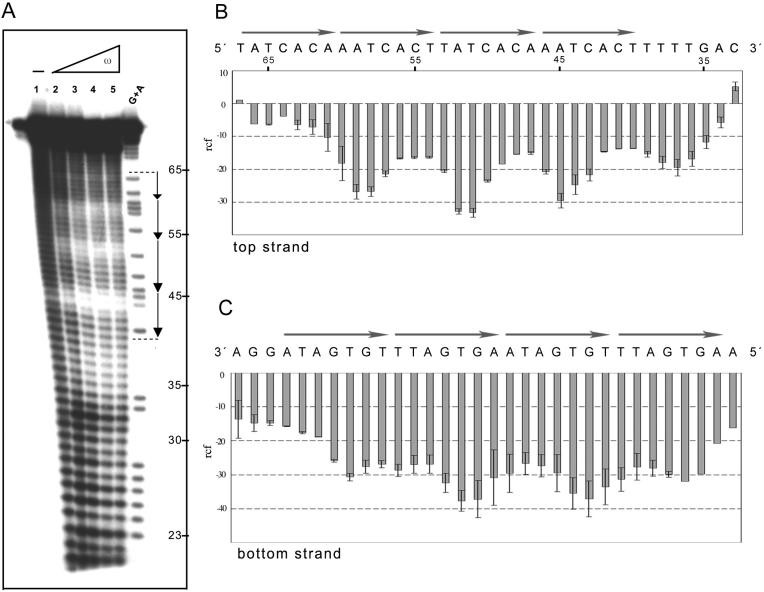
Figure 6.
Hydroxyl radical footprinting of ω2 protein bound to DNA with four heptads. The 78 bp [α-32P]EcoRI–SphI [top strand (A and B)] or the 73 bp [α-32P]HindIII–KpnI [bottom strand (C)] (2 nM) with four DNA heptads in —→4 orientation, in the presence of 1 µg of poly[d(I-C)] as non-specific competitor DNA, was incubated with increasing concentrations of ω2 for 15 min at 37°C in buffer B, followed by hydroxyl radical footprinting. The ω2 concentrations were 8, 16, 32 and 64 nM (lanes 2–5). The symbol – in lane 1 indicates the absence of protein. The G+A bands were used as size standards. The nucleotide sequence of the —→4 DNA and the histogram of the hydroxyl radical footprinting of the top (B) and bottom (C) strands, are shown. The relative cleavage frequency (arbitrary units) of the bound DNA compared to the unbound control is shown. Error bars show standard deviations and represent average values from three independent experiments.

