
Fig.1.
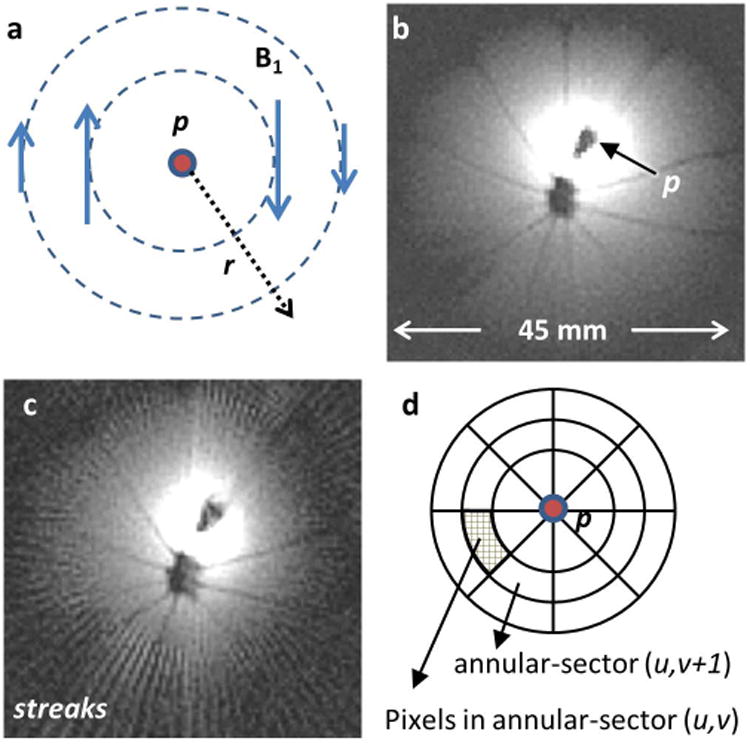
(a) The transverse field of a loopless antenna detector p showing decreasing B1 with r and azimuthal variation in phase. (b) Typical IVMRI image of an orange obtained from probe p, showing intense bright region closest to the probe. (c) Four-fold under-sampling of the image in (b) and conventional FT reconstruction showing streaking. The r-1 intensity filter has not been applied to (b) or (c). (d) Template used to calculate the Spokal Variation (SV) from adjacent annular sectors as explained in the text. The center of the template is placed on p.