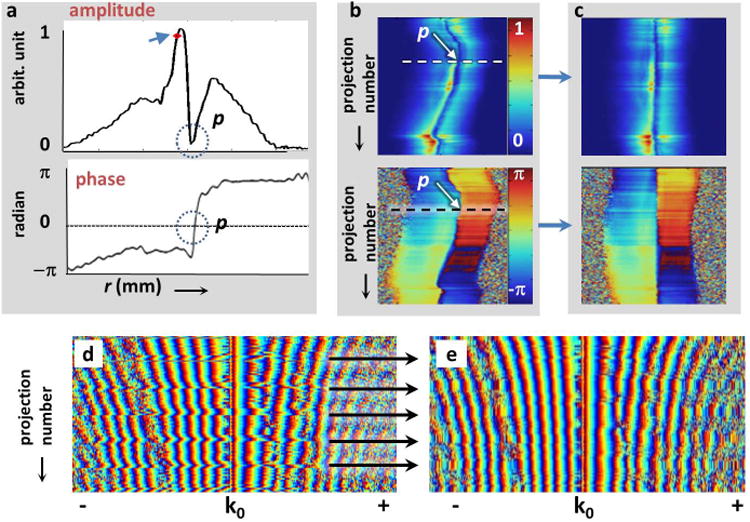
Fig.2.

(a) Typical experimental projections from the semi-rigid loopless antenna in an orange. The amplitude of the projection (top) shows a ‘crater’ at the probe location (p, circled). The center-of-mass of the projection (arrowhead) is displaced from the probe-location. The phase (bottom) of each projection reverses at p (circled). (b) The probe's location (arrow) appears as a meandering anomaly in the stack of 200 projections (top, amplitude; bottom, phase), each acquired sequentially at 0.9° azimuthal increments. Each projection spans the FOV; the stack spans a circle. The projection in (a) is annotated (dashes). (c) Motion correction consists of re-aligning every projection based on p. A stack of phase plots of in vivo k-space projections from a rabbit acquired with a nitinol loopless antenna are shown in parts (d) and (e). Periodic aberrations (arrows) evident in (d), are replaced by the average of preceding and successive projections (e), to yield images with reduced streaking.
