Figure 2.
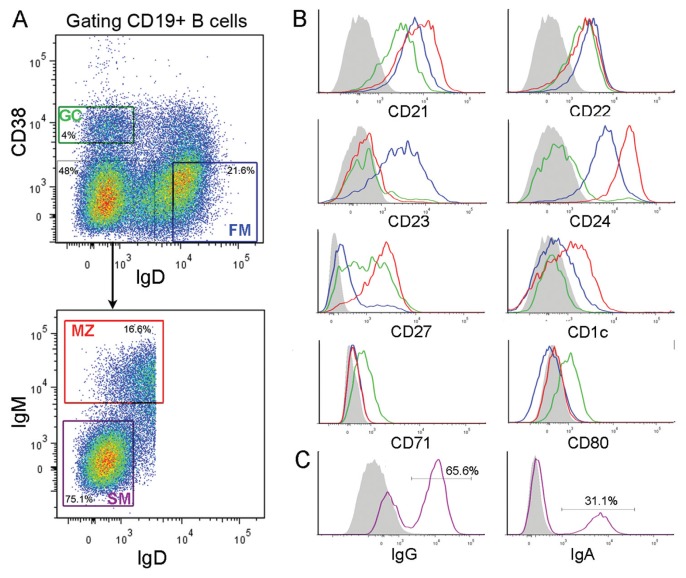
Fluorescence-activated cell sorting and phenotypic characterization of MZ, FM and GC B cells. (A) Plots shown are gated on CD19+ B cells. Staining for sIgD/CD38 expression enables the separation of FM, GC and IgD−CD38− B cells. The latter cells are further separated into MZ and SM B cells as indicated. Numbers indicate the percentage of cells in the boxes. (B) Cell surface marker analysis of the purified B-cell subsets. (C) Staining for sIgG or sIgA of SM B cells. The gray area represents the negative control staining with an unrelated mAb. Red, green, blue and purple line colors correspond to MZ, GC, FM and SM, respectively.

