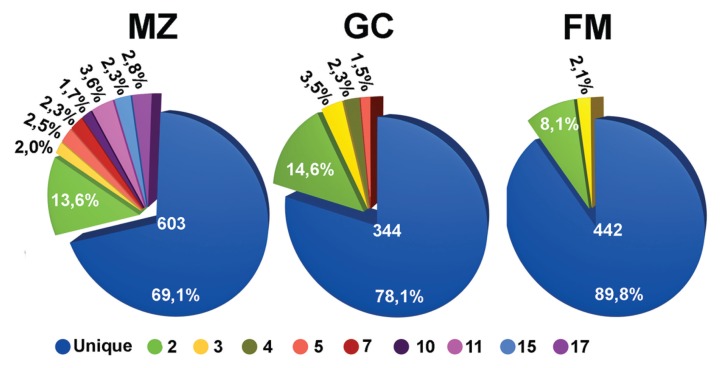
Figure 3.
Frequency of recurrent clones in different B-cell subpopulations. Pie charts summarizing the proportion of unique (blue) and recurrent (other colors) sequences in the FM, GC and MZ B cell subsets. The total number of sequences analyzed is indicated in the center. Different colors indicate the clonal families characterized by a different number of recurrent sequences, as specified at the bottom of the figure.

