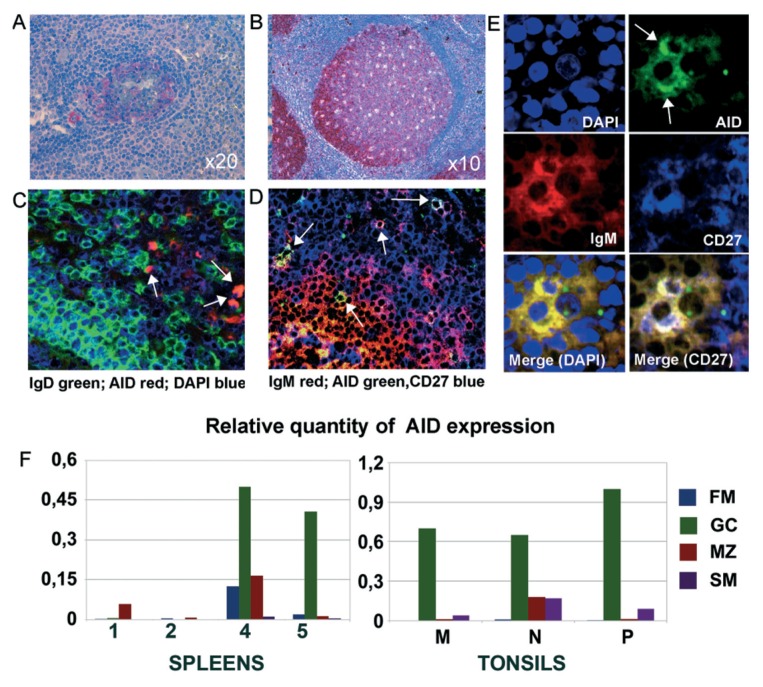
Figure 6.
AID expression in MZ B cells by in situ staining and qRT- PCR. (A) Paraffin sections of spleen and (B) tonsil stained for AID by immunohistochemistry (20×). Staining is very weak in spleen and much stronger in tonsil GC. Sparse AID+ cells are localized in the tonsil intrafollicular areas and in the splenic MZ. (C, D) Confocal microscopy view of frozen spleen sections from a different spleen stained for AID and the indicated Ig isotypes. (E) Higher magnification view of two AID+ MZ B cells stained as reported. (F) AID relative expression measured by qRT-PCR analysis in different B-cell subsets isolated from spleens and tonsils. Bars represent the relative quantity of AID normalized to POL2 calculated as 2−ΔCt.

