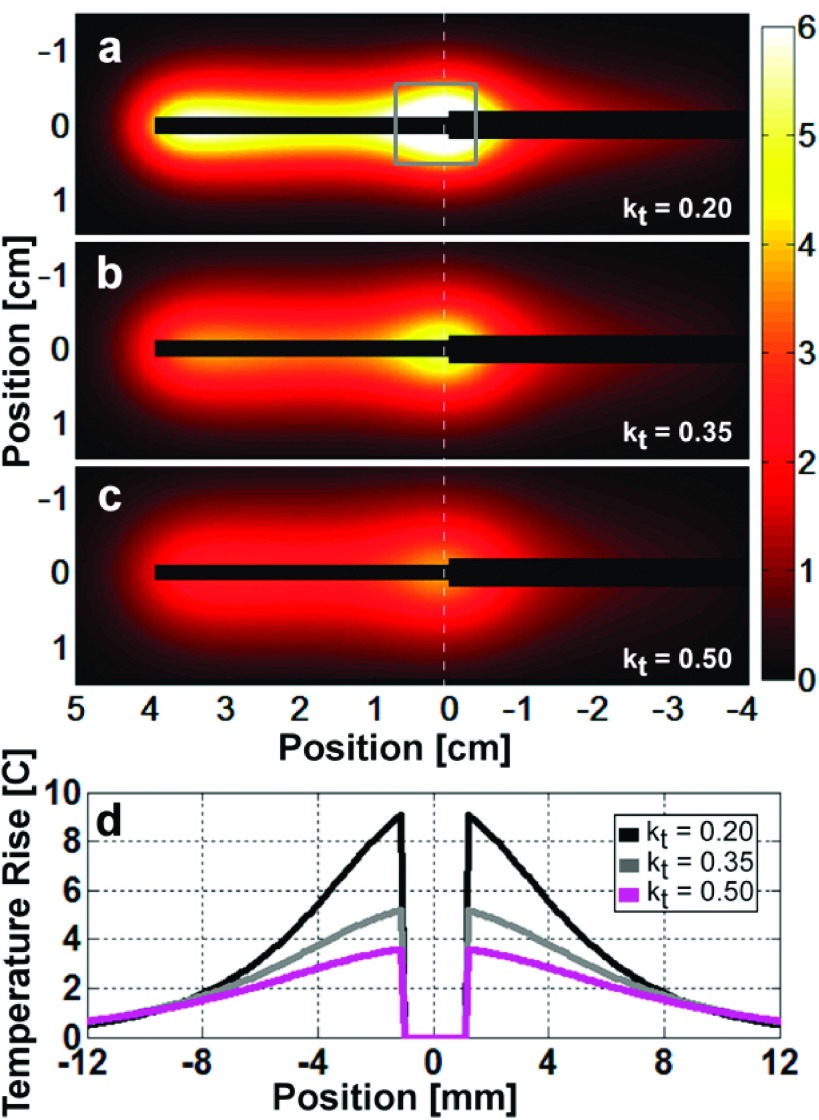
FIG. 10.
Simulated 4.1 mg-averaged temperature rise 10 s after a 4 W 100 s-long RF exposure for thermal conductivity values of (a) 0.20, (b) 0.35, and (c) 0.50 (W/m)/K. (d) The temperature profiles along the white dashed lines show that as the thermal conductivity decreases, the peak temperature rise increases, and the distribution is more tightly confined about the junction. The gray annotated square in (a) represents the volume used to calculate the peak 1 g-averaged temperature rises and H-factors.

