
FIG. 3.
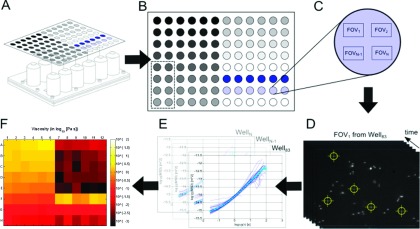
Data collection and analysis workflow for AHT microscope experiment. (a) Schematic of a specimen-loaded multiwell plate above the 12-channel objective array. (b) Layout of a specimen plate for a “concentration sweep” type rheology experiment. The grey-scale gradient represents increasing concentration of a polymer solution (see Sec. IV and application to HA). The dashed rectangle partitions the wells accessed by the 7th objective in the array (see Figure 1(c)). (c) Blow-up of a well within the multiwell plate. After video is collected in each of the 8 wells accessed by the objective array, additional passes through the wells can be made. This schematic shows multiple locations, or FOV, for video collection within the given well. (d) Video data acquisition and single particle tracking. Once data are collected, the video for each FOV is tracked using particle tracking software (cismm.org) to generate time-series position measurements. (e) The MSD is computed for each particle (blue curves) using Eq. (1) and the ensemble sample-weighted average is computed (cyan curve). (f) The average MSD is transformed into the complex modulus using Eq. (2) and visualized in a heatmap at a particular timescale. Here, the experiment described in Sec. IV is shown in terms of the magnitude of the complex viscosity, at the 1 s timescale (see Figure 7(a)).