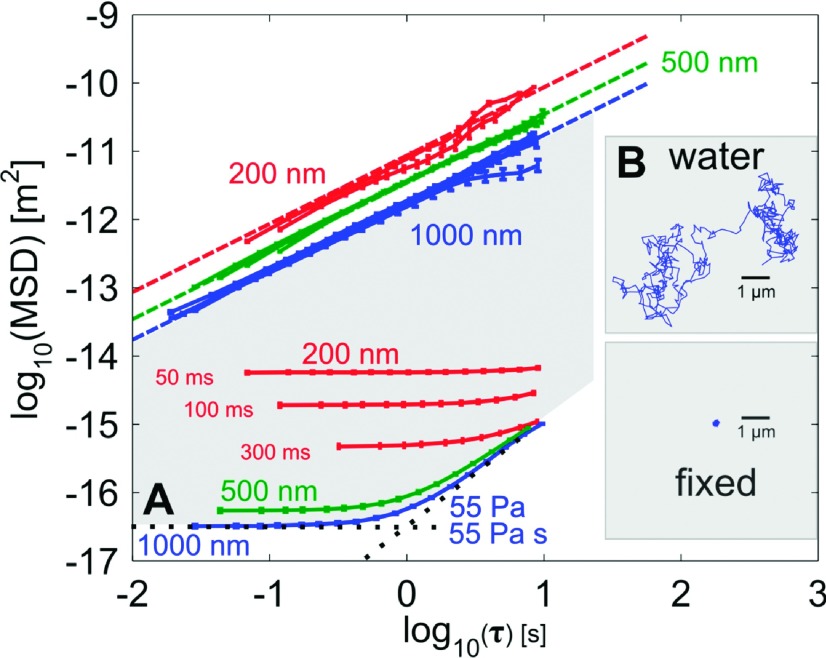
FIG. 5.
Limits of measure for the AHT microscope shown as MSDs for different bead sizes in water or attached to the substrate of the multiwell plate. Bead sizes are labeled according to color: blue (1 μm), green (500 nm), and red (200 nm). (a) The lowest noise floor corresponds to 55 Pa maximum G′ and a 55 Pa s maximum η′ for a 1 μm bead diameter due to high signal and larger pixel sampling. The shaded region corresponds to the measurement space available to the AHT with a 1 μm bead. The 500 nm bead shows a slightly higher noise floor for a similar SNR because of the lower pixel sampling. Three different exposure times are shown for the 200 nm bead diameter, showing how the lower SNR degrades the noise floor and raises the SLE. (b) Shown are data from all bead sizes diffusing through water. The dashed lines indicate the expected MSD for water at the appropriate temperature. All bead sizes sampled for the exposure times shown in the figure exhibit low dynamic localization error (<10%) except for the 200 nm beads at 50 ms exposure time which was <20%. To increase the exposure time for the 200 nm bead would further reduce the SLE and result in a correspondingly higher DLE. Inset: Example trajectories for a 1 μm bead diffusing through water, or fixed to the plate substrate.

