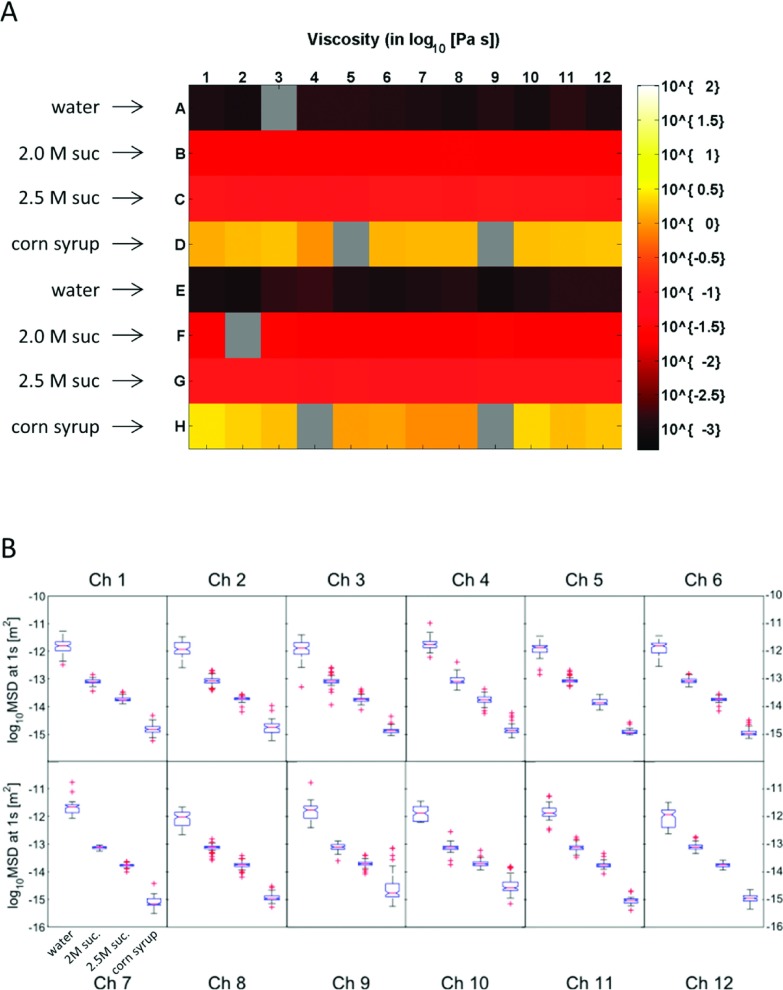
FIG. 6.
Characterization of standard Newtonian fluids using the AHT microscope. (a) Viscosity heatmap for alternating rows of water, 2.04 M sucrose, 2.5 M sucrose, and corn syrup. The materials were dosed with 1 μm fluorescent beads and a 50 μl volume was loaded into each well of a 96-well plate. Five 2 min videos at 34 fps were taken at different FOVs in each well. The viscosity at the 1 s timescale is plotted, obtained using the workflow shown in Figure 4. Gray wells indicate positions where the AHT system collected no data, which happens randomly and with low probability. (b) Boxplots of the fluid-aggregated MSD distributions at the 1 s timescale by channel (each channel was loaded with two wells of each fluid). For each distribution, the boxes denote the 25th (Q1) and 75th (Q3) percentiles, whiskers extend to non-outlier data defined by Q3 + 1.5∗(Q3 − Q1) and Q1 − 1.5∗(Q3 − Q1) and symbolized with (+). An ANOVA test was performed on the MSD distributions of each fluid. Results indicated that each channel could statistically distinguish each fluid (p ≪ 0.0001).

