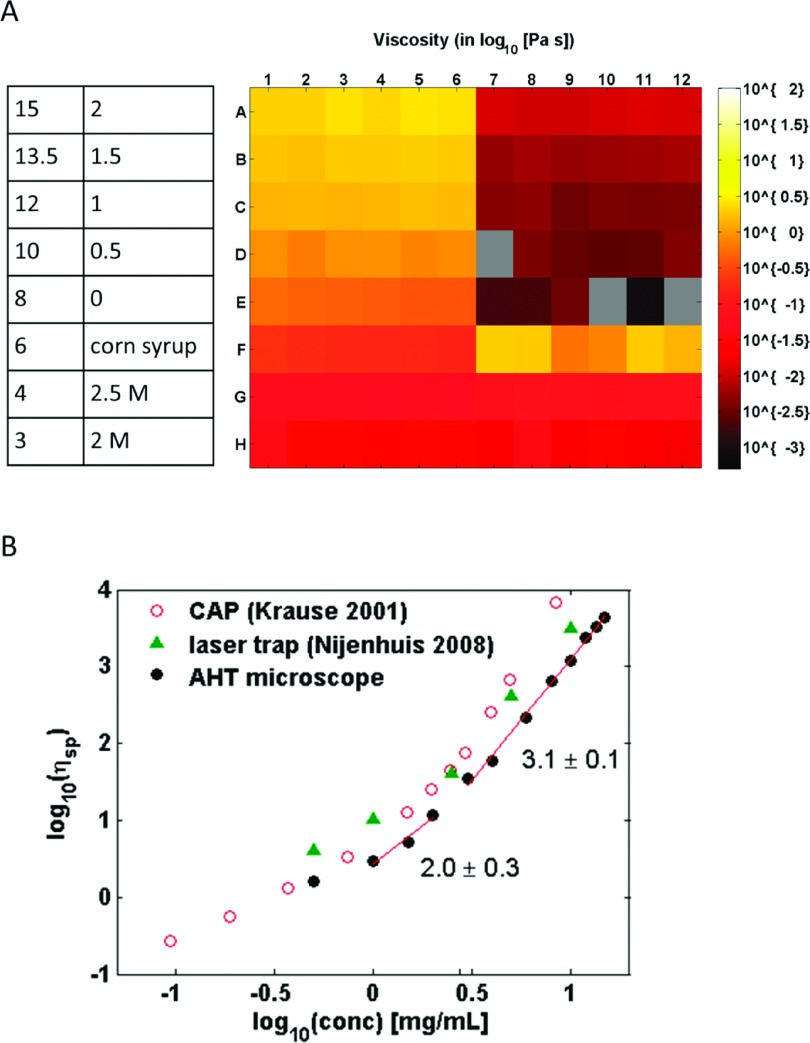
FIG. 7.
High-throughput passive microbead rheology of HA: (a) Viscosity heatmap for a multiwell plate that contained a HA concentration sweep with 6 replicate wells (concentrations shown in table on left). Well locations that are gray contain no data. Viscosity standards are shown in the bottom-right of the heatmap. The reported viscosity for the HA solutions decreases with a corresponding decrease in concentration. (b) Plotting the specific viscosity of HA as a function of its concentration reveals power-law relationships similar to those found in previous literature using different rheological methods.

