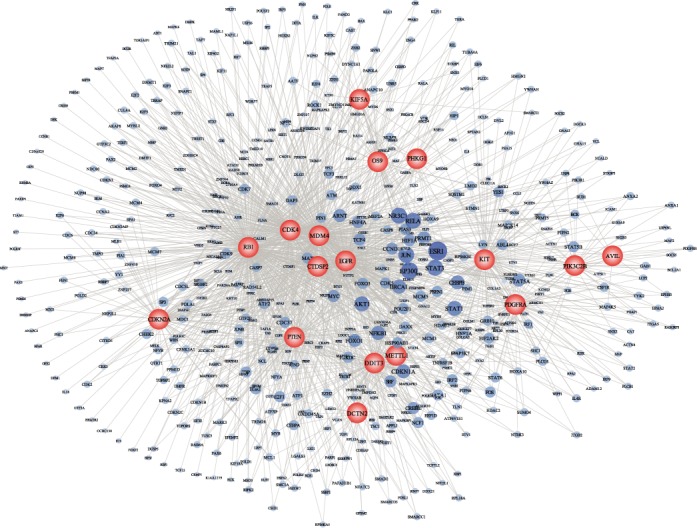
Figure 3.

Comprehensive dysregulated network induced by the core module. Two types of nodes represent the member genes and dysregulated gens, respectively. The node size for member genes is proportion to the number of member genes connecting to the dysregulated genes.
