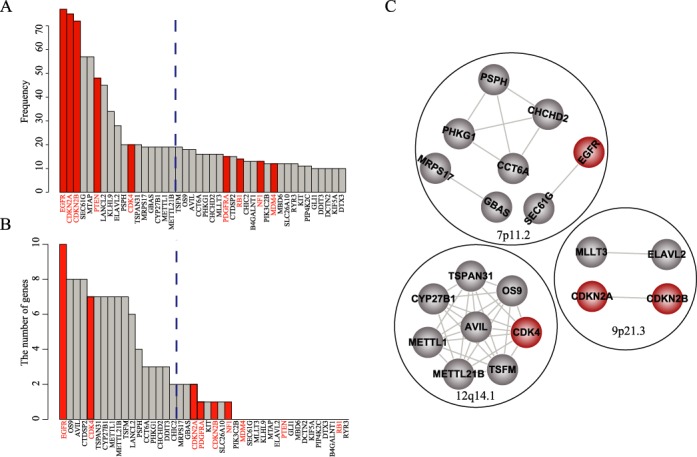
Figure 6.

Comparison with other methods. (A) Gene list identified by the frequency-based method, which was ranked based on alteration frequency. (B) Gene list identified by the fisher-based method, which was ranked by the number of related genes. Dashed lines indicate the threshold for top 17 genes. (C) The gene modules identified using the differentially expressed genes. Genes in the same black circle are located in the same chromosomal region. EGFR, CDKN2A, CDKN2B, PTEN, CDK4, PDGFRA, RB1, NF1, MDM4 were known GBM associated genes.
