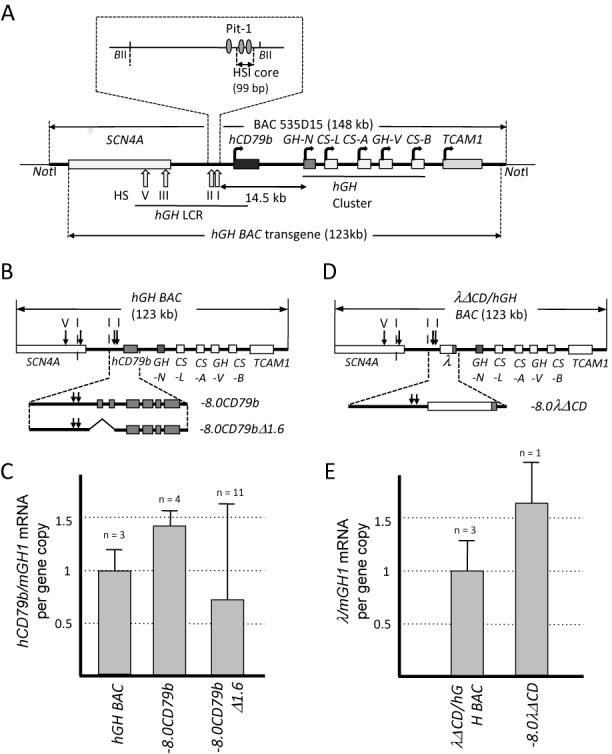
Figure 1.

HSI activates noncoding transcription independent of promoter interactions. (A) Map of the hGH locus and the hGH BAC transgene. Each structural gene in the hGH locus is indicated along with its transcriptional orientation. The 123 kb hGH BAC transgene released from the originating BAC clone (BAC535D15) by NotI digestion was used to generate the hGH BAC transgenic mouse lines (26). The vertical arrows labeled with roman numerals indicate the positions of DNase I hypersensitive sites (HS) that form in pituitary chromatin and constitute the hGH LCR. The distance (14.5 kb) between the 3′ end of the HSI core and the hGH-N gene promoter is indicated with double-headed arrow. Note that this region encompasses the hCD79b gene that encodes the B-cell specific Ig receptor component, Igβ. Pit-1 binding sites that constitute core determinants of HSI are indicated by the shaded ovals (expanded inset). The 99 bp deletion that inactivates HSI functions (18) is also shown in expanded view (inset above). (B) Map of the wild-type hGH BAC and two derivative transgenes. The −8.0CD79b transgene (12.5 kb) encompasses HSI and the contiguous hCD79b (expanded view below the hGH locus map) and isolates this region from the hGH gene cluster. The −8.0CD79bΔ1.6 transgene was derived from the −8.0CD79b by deletion of a 1.6-kb internal fragment extending from −0.5 kb of the promoter through intron 2, removing all defined hCD79b promoter elements. (C) Noncoding transcription across hCD79b in the transgenic mouse pituitary is preserved in the absence of defined promoter elements. Transcription across the hCD79b region generated by the promoterless −8.0CD79bΔ1.6 was compared to that of the −8.0CD79b transgene (containing the intact hCD79b promoter but not the hGH-N promoter) and the hGH BAC transgene (containing both the hCD79b and the hGH-N promoters). Pituitary RNA from mice carrying each of these indicated transgenes was assayed for transcription across hCD79b by RT-qPCR. The data shown in the histogram (Y-axis) have been normalized to the corresponding transgene copy numbers and to somatotrope-specific levels of the endogenous mouse growth hormone (mGH1) mRNA. The number of genetically distinct lines assessed for each transgene is noted above the corresponding bars in the histogram. Each line was tested in triplicate using three independent mice. Values represent the average ± SD. The level of hGH BAC was defined as 1.0. (D) Map of the 123 kb λΔCD/hGH transgene and the derivative the −8.0λΔCD transgene. This transgene was generated by replacing the hCD79b gene and promoter (to −500 bp) with a size-matched fragment of bacteriophage λ DNA within the context of an otherwise intact hGH BAC (see ‘Materials and Methods' section). The −8.0λΔCD transgene was released from the λΔCD/hGH transgene with boundaries as indicated. (E) Noncoding transcription is activated 3′ of HSI within an inserted (λ) DNA segment. Transcription across the λ-DNA region was compared between the λΔCD/hGH and −8.0λΔCD transgenes. λ noncoding transcription was measured by RT-qPCR, normalized to transgene copy-number and to mGH1 mRNA levels. λ noncoding transcription was actively transcribed without hGH-N promoter. The number of genetically distinct lines assessed for each transgene is noted above the corresponding bars in the histogram. Each experiment was carried out in triplicate. The study of the single −8.0λΔCD line was evaluated in each of three independent mice, each studied in triplicate. Values represent the average ± SD.
