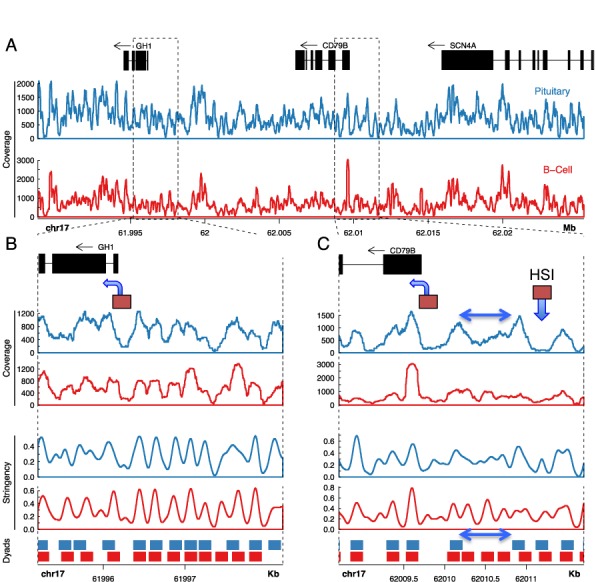
Figure 5.

Nucleosome occupancy at the hGH BAC transgene locus reveals a singular chromatin configuration in the pituitary at HSI and in the region between HSI and the hCD79b promoter. (A) Sequence coverage of MNase-generated mononucleosomes across the region encompassing the hGH-N and hCD79b genes in the hGH BAC transgene. Mononucleosome-protected DNA generated by MNase digestions (Figure 4) from splenic and pituitary nuclei of hGH BAC transgenic mice were converted into NGS libraries and sequenced to a minimum 10× genome coverage (Table 1). Sequence data was mapped to the chimeric hGH BAC transgenic genome. Gene annotations are depicted at the top of the figure (in black). Nucleosome coverage as determined by sequencing of mononucleosomes generated by the MNase digestions (Figure 4) from pituitary and B cells are plotted below (blue and red, respectively). The genome coordinates are indicated below the coverage plots. (B and C). Expanded views of the hGH-N promoter region and hCD79b promoter-HSI region, respectively. Gene annotations are depicted in the top panel in black, and the hGH-N and hCD79b promoters are each indicated by boxes with an arrow in the direction of transcription. The HSI core region is indicated by a box and downward arrow. Pituitary and B-cell nucleosome ‘coverages’ are plotted in the first and second panels, followed by the ‘stringency’ plots in the third and fourth panels, followed by the nucleosome ‘dyad positioning’ plots in the bottom panel (as labeled). Stringency plots represent the fraction of defined nucleosome positions in a region (29). Dyad positioning plots depict regions occupied by nucleosomes at high stringency (>50%). The double-headed arrow in figure (C) represents the region of disordered nucleosomes between HSI and the hCD79b promoter that is specific to the pituitary locus.
