
Figure 2.
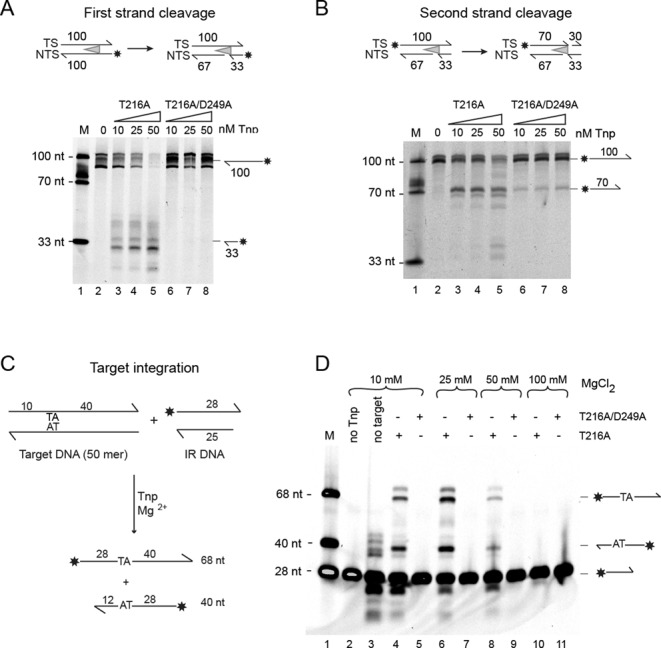
In vitro DNA cleavage and integration activities of Mos1 transposase (Tnp) mutants. (A) First strand cleavage assay shown schematically (with the asterisk indicating the IRDye® 700 label). Reaction products, separated by denaturing polyacrylamide gelelectrophoresis (PAGE), are indicated to the right of the gel. Lane 1 contains labelled DNA markers and the reaction in lane 2 is without transposase. Reactions in lanes 3–5 were performed with T216A Mos1 transposase, at concentrations of 10, 25 and 50 nM, respectively, whereas reactions in lanes 6–8 contained T216A/D249A transposase. (B) Second strand cleavage assay, with conditions identical to those described for the first strand cleavage assay. (C) Schematic of the in vitro DNA integration assay. Integration of the labelled IR DNA into the top strand of target DNA yields a 68 nt labelled product, whereas integration into the bottom strand produces a 40 nt labelled product. (D) Comparison of the activity of the T216A and T216A/D249A Mos1 mutant transposases. Reaction products were separated by denaturing PAGE. Reactions in lanes 4–11 contained transposase and MgCl2 at 10, 25, 50 or 100 mM, as indicated. Lane 1 contains DNA markers. The control reactions in lanes 2 and 3 had no transposase or no target DNA added, respectively.