
Figure 5.
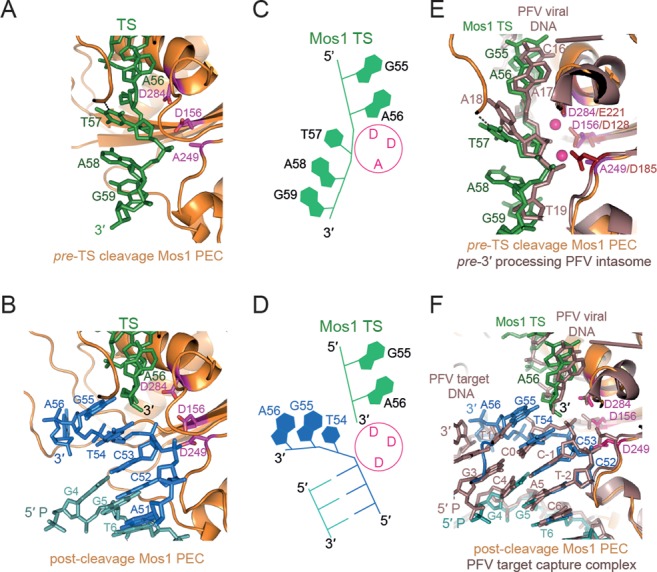
Comparison of the flanking DNA in the pre-TS cleavage Mos1 PEC, post-cleavage Mos1 and PFV intasomes. (A) Route of the TS (green), including the flanking DNA TpA target site duplication, in the pre-TS cleavage Mos1 PEC. (B) Position of the cleaved TS (green) and additional DNA duplex (blue) in the post-cleavage Mos1 PEC (PDB ID: 3HOS). The active site residues (DDD) are shown as magenta sticks. (C) Schematic of the pre-TS cleavage Mos1 PEC structure highlights the 5′ to 3′ polarity of the TS. (D) Schematic representation of the post-cleavage Mos1 PEC, showing the 3′ end of the cleaved TS and the opposing polarity of the strands of the additional IR DNA duplex. (E) Superposition of the pre-TS cleavage Mos1 PEC (orange), where the Mos1 TS is shown in green, with the pre-3′ processing Prototype Foamy Virus (PFV) intasome (PDB: E47I), coloured violet brown. (F) The post-cleavage Mos1 PEC (PDB ID: 3HOS), shown in the same orientation and colour scheme as part (B), superposed with the PFV target capture complex (PDB ID: 3OS2) coloured violet brown. The additional DNA duplex (blue) in the Mos1 PEC closely aligns with the PFV target DNA.