
Figure 1.

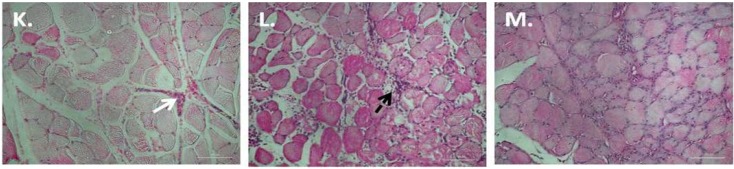
Ultrastructural changes over time after experimental contusion injury, stained by H & E. Figure (A) represent uninjured samples; Figures (B–D) represent samples taken from PLA animals at 3 h (B), 1 day (C) and 7 days (D) post-injury; Figures (E–G), (H–J) and (K–M) represent similar time points in the PG-CHR, PG-AI and NSAID groups respectively. Scale bar represents 100 μm; Figures (B), (E), (H) and (K) represent muscle fiber destruction and vascular disruption; Immune cells infiltration into the injured area is visible from 1 day post-injury (Figures (C), (F), (I) and (L)). Solid white arrows indicate red blood cells, solid black arrows points to newly regenerated muscle fibers and dashed arrows indicate immune cells.