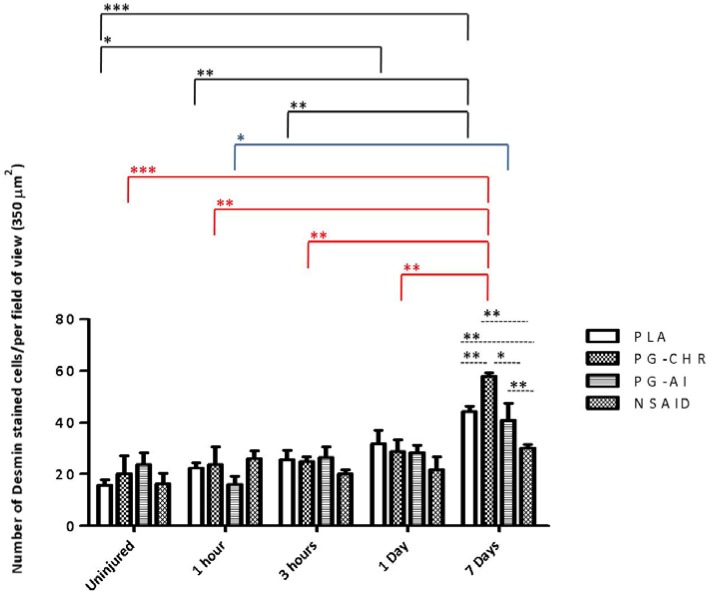
Figure 5.
Desmin expression in skeletal muscle following a contusion injury. The data are expressed as mean ± SEM; Analysis by two-way ANOVA; n = 5 per time-point/per group; Differences over time are indicated by solid black lines (PLA), solid blue lines (PG-CHR), solid red lines (PG-AI) and broken black lines indicate group differences at specific time points; Significance: *** p < 0.0001, ** p < 0.001 and * p < 0.05.

