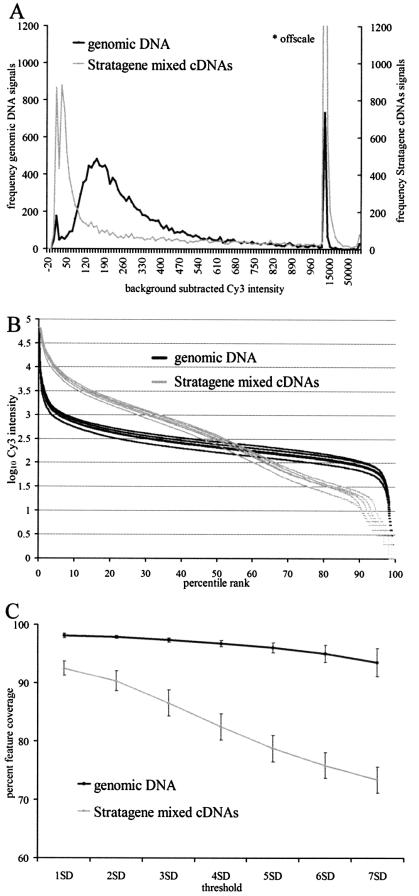
Figure 2.
Comparison of genomic DNA cohybridization standard (black trace) with the Stratagene Mouse Universal Reference RNA standard (gray trace). (A) Intensity distributions from two separate hybridization experiments are compared. The background-subtracted denominator values are plotted on the horizontal axis, which is arranged with varying bin widths to accommodate the full intensity range. Values between –20 and 1000 have a bin width of 5, and values from 1000 to 70 000 have a bin width of 5000. (B) Comparison of percentile rank plots of Cy3 intensities for five replicate experiments in which genomic DNA (black traces) or Stratagene mixed cDNAs (gray traces) were co-hybridized with Cy5-labeled C2C12 cDNA to the mouse 16K chip. Log10 of the background subtracted intensity values (y-axis) were sorted, and assigned a percentile rank (x-axis). (C) Comparison of array feature coverage for RNA and genomic DNA cohybridization standards. The mean percent mouse feature coverage as a function of increasing threshold value is shown for five replicate experiments. Background thresholds are defined as the median fluorescence intensity for the group of negative control features, plus a multiple of the standard deviation value for the negative controls group (i.e. median negative controls + 1 SD, etc.). The feature coverage percentage is defined as the number of features exceeding a given background threshold value divided by the total number of mouse features on the array, multiplied by 100. Mean and standard deviation for the replicate groups at each threshold are plotted.

