Figure 4.
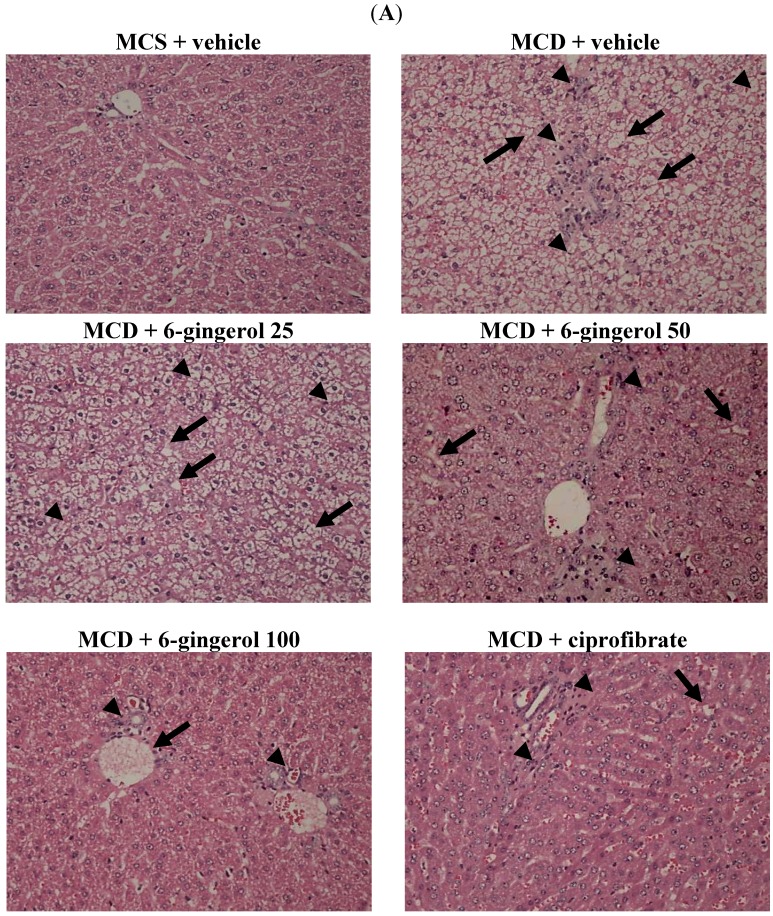
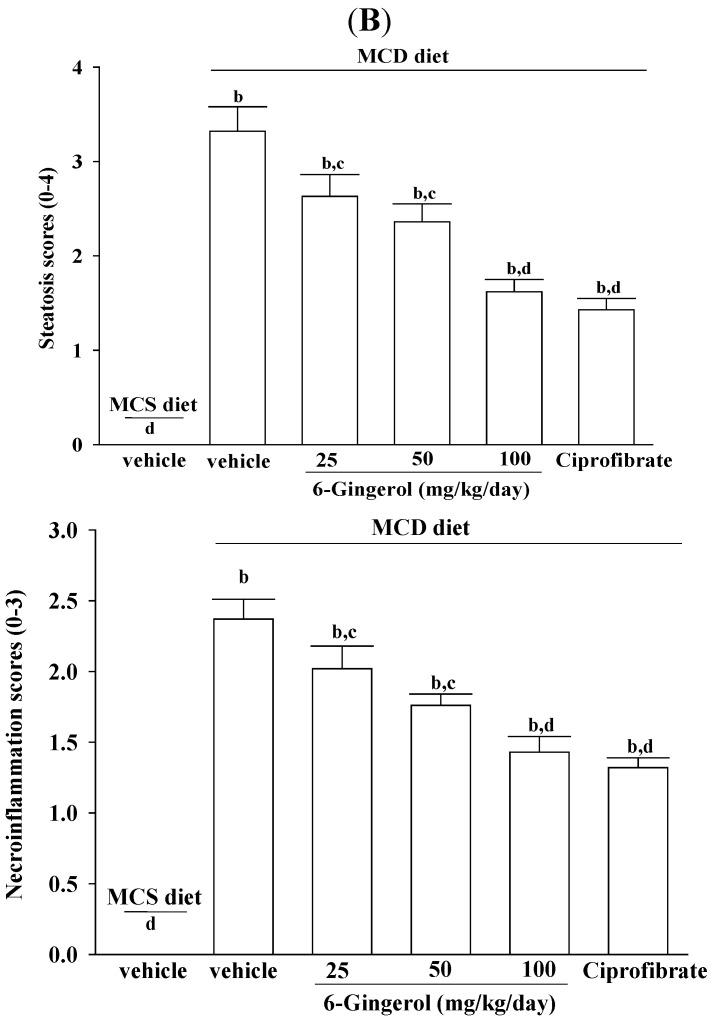
Effects of different treatments on liver histology. (A) Representative images of hematoxylin and eosin stained livers from MCS diet- and MCD diet-fed mice after four-weeks of 6-gingerol or ciprofibrate treatment. The vehicle (distilled water) used to prepare the test medication solutions was given at the same volume. Photomicrographs (original magnification, 200×) of tissues isolated from vehicle-treated MCS diet-fed mice (MCS + vehicle), vehicle-treated MCD diet-fed mice (MCD + vehicle), 25 mg/kg/day (MCD + 6-gingerol 25), 50 mg/kg/day (MCD + 6-gingerol 50), and 100 mg/kg/day (MCD + 6-gingerol 100) 6-gingerol-treated MCD diet-fed mice. Another group of MCD diet-fed mice was orally administered 10 mg/kg/day of ciprofibrate (MCD + ciprofibrate). Arrows and arrowheads indicate fat droplets and necro-inflammatory foci, respectively. (B) Hepatic steatosis and necro-inflammation scores. Results are means ± SD for eight mice/group after four weeks of treatment. a p < 0.05 and b p < 0.01 compared to the values of vehicle-treated MCS-diet fed mice. c p < 0.05 and d p < 0.01 compared to the values of vehicle-treated MCD-diet fed mice.


