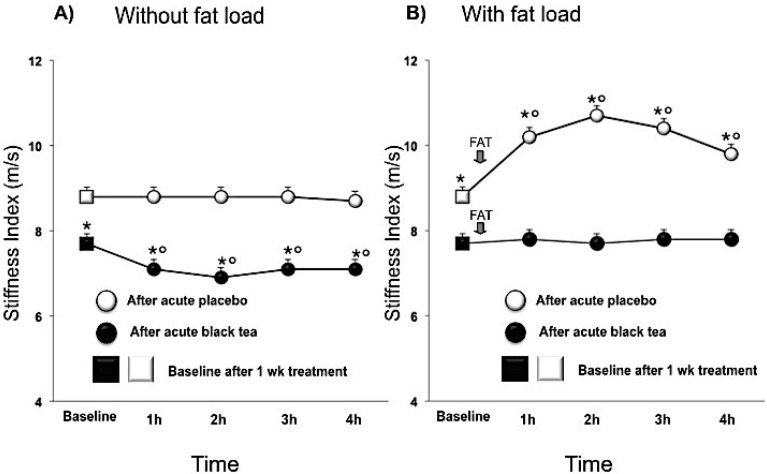
Figure 1.
Effect of 1 week placebo (white) and black tea (black) administration on baseline (square) values (Panel A and B) of stiffness index and acute effects without and with fat load (Panel A and B). Data are presented as LSmeans ± SE. In all panels vertical lines indicate SE and asterisks (*) indicate significant differences with respect the placebo phase (Panel A and B) while circles (°) indicate significant differences from baseline values (Panel A and B). Differences are considered significant when p < 0.05.

