
Figure 2.
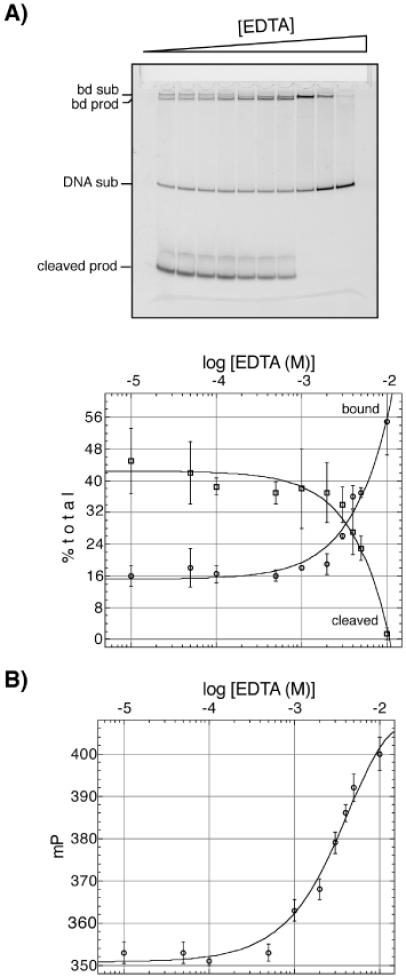
A comparison of FP and gel-shift assays indicates that FP is a good measurement of the degree of Tn5 Tnp-induced strand cleavage. In order to access the relationship between fluorescence polarization and strand cleavage, we compared the degree of strand cleavage that occurred as a function of various EDTA concentrations under the same conditions. Increasing concentrations of EDTA (0, 0.01, 0.05, 0.1, 0.5, 1, 2, 3, 4, 5, 10, 20, 50 M) were used as a mock inhibitor during assay development. (A) Strand cleavage reactions were incubated at 37°C for 1.5 h and subsequently loaded onto a 9% native gel for gel-shift assays. The DNA was detected using 5′ fluorescein labeled oligonucleotides. Bd sub indicates the Tnp–DNA substrate complex, bd prod indicates the Tnp–DNA product complex, DNA sub is the substrate, and cleaved prod is the donor DNA cleavage product. The graph represents the percentage of DNA cleavage products compared with the amount of DNA bound by the Tnp per lane from data collect from multiple gel-shift assays. (B) Strand cleavage reactions were incubated at 37°C for 1.5 h prior to the FP measurement. The oligonucleotides were labeled with rhodamine green on the 5′ end of the non-transferred strand for these experiments. The graph represents the change in FP signal with increasing concentrations of EDTA. These data indicate that the polarization and strand cleavage data are in good agreement, since the concentration of EDTA that inhibits cleavage is along the same order of magnitude that the polarization begins to increase.