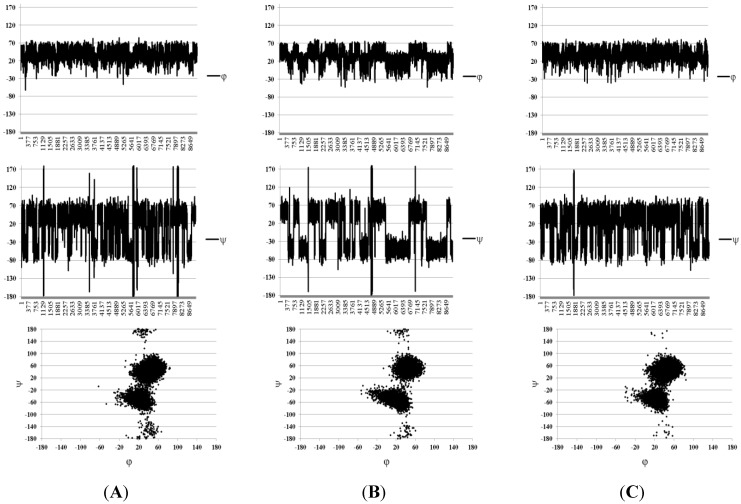
Figure 4.
Molecular dynamics (MD) graphs and conformational plots obtained in the Solvent Accessible Surface Area (SASA) approximation for disaccharides 1–3 ordered from (A) to (C). Angles φ and ψ are defined as H1–C1–O–Cx and C1–O–Cx–Hx, respectively, for the sake of compatibility with the Karplus equation.

