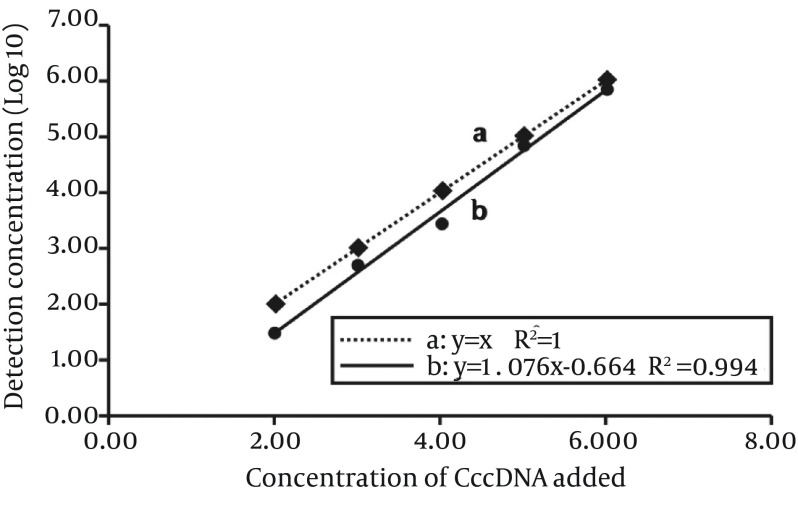
Figure 5. Linear and Regression Analyses Between Expected Values of cccDNA Concentration and Values Determined by MCH-qPCR.
Line-a was the curve fitted between the actual added concentration (log10) and the expected concentration (log10), y = x, R2 = 1; Line-b was the curve fitted between the concentration determined (log10) by MCH-qPCR and the expected concentration (log10).

