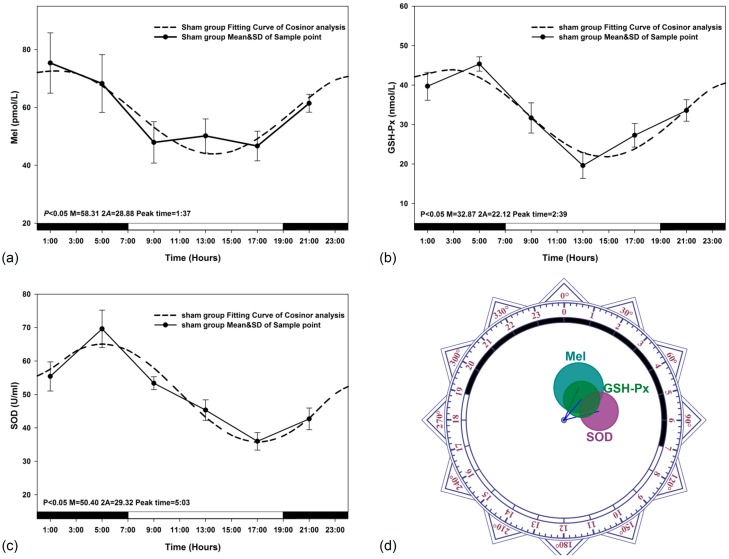
Figure 3.
Sham-exposed rats. The best-fitting curves (means ± standard error) determined for Mel (a); GSH-Px (b) and SOD (c); Y-axis represents Mel/GSH-Px/SOD concentration in the plasma; x-axis represents the Time during the 24 h light-dark cycle; (d) Zero-amplitude test for circadian rhythms of Mel, GHS-Px and SOD concentration. The circles represent the 95% joint confidence intervals of amplitude and acrophase. The pole (zero-point) of the polar coordinate was not overlapped by the circles, namely the zero amplitude hypothesis was rejected because of p < 0.05, which indicates a distinct circadian rhythmicity of Mel, GSH-Px and SOD.

