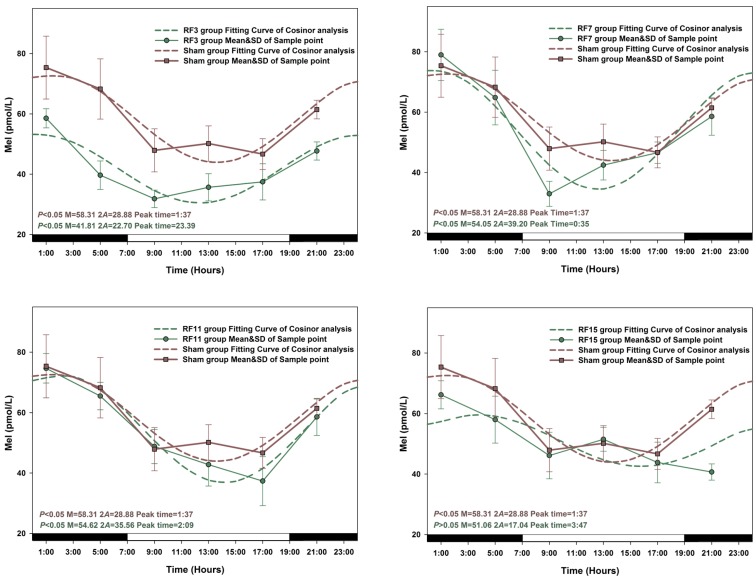
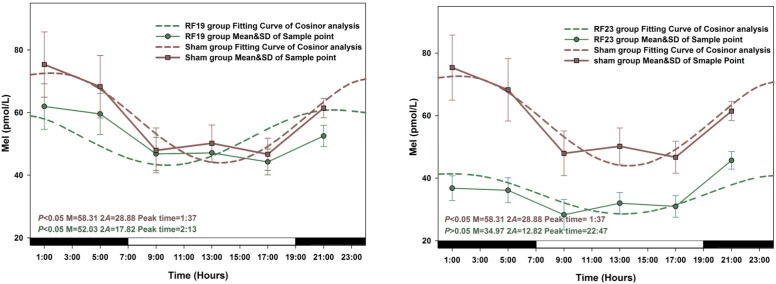
Figure 4.
The best-fitting curves (means ± standard error) determined for Mel in RF and Sham-exposed rats. Y-axis represents Mel concentration in the plasma; x-axis represents the Time during the 24 h light-dark cycle. For time-effect, p values from Zero-amplitude test, as well as the median (M), the double amplitude (2A) and the time of peak phase (Peak time) of the 24 h cosine curves, are listed. The circadian rhythm is regarded as significant when p < 0.05.


