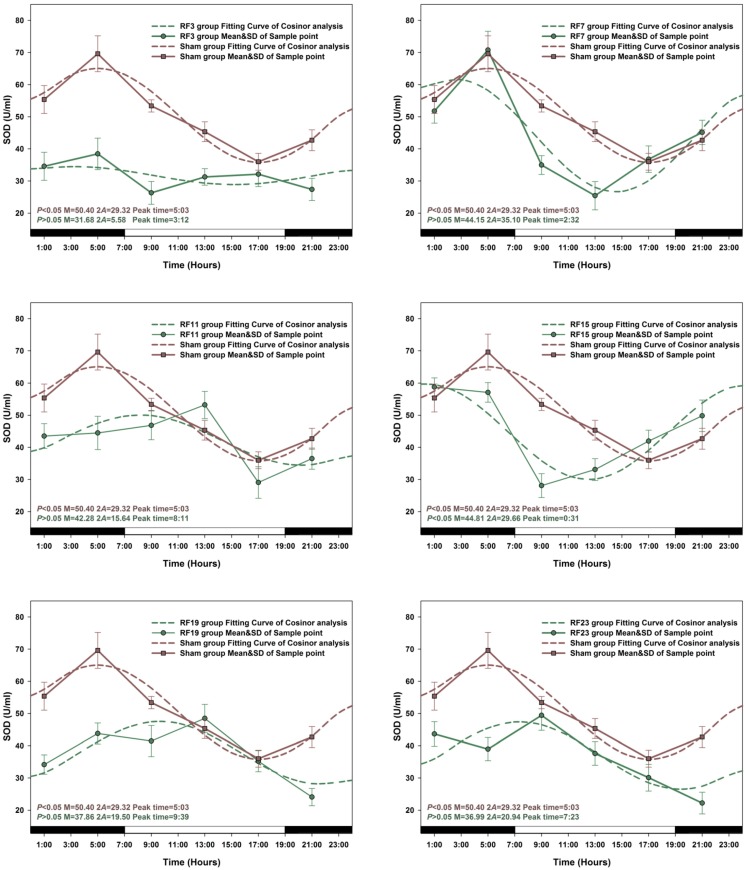
Figure 6.
The best-fitting curves (means ± standard error) determined for SOD in RF and Sham-exposed rats. Y-axis represents SOD concentration in the plasma; x-axis represents the Time during the 24 h light-dark cycle. For time-effect, p values from Zero-amplitude test, as well as the median (M), the double amplitude (2A) and the time of peak phase (Peak time) of the 24h cosine curves, are listed. The circadian rhythm is regarded as significant when p < 0.05.

