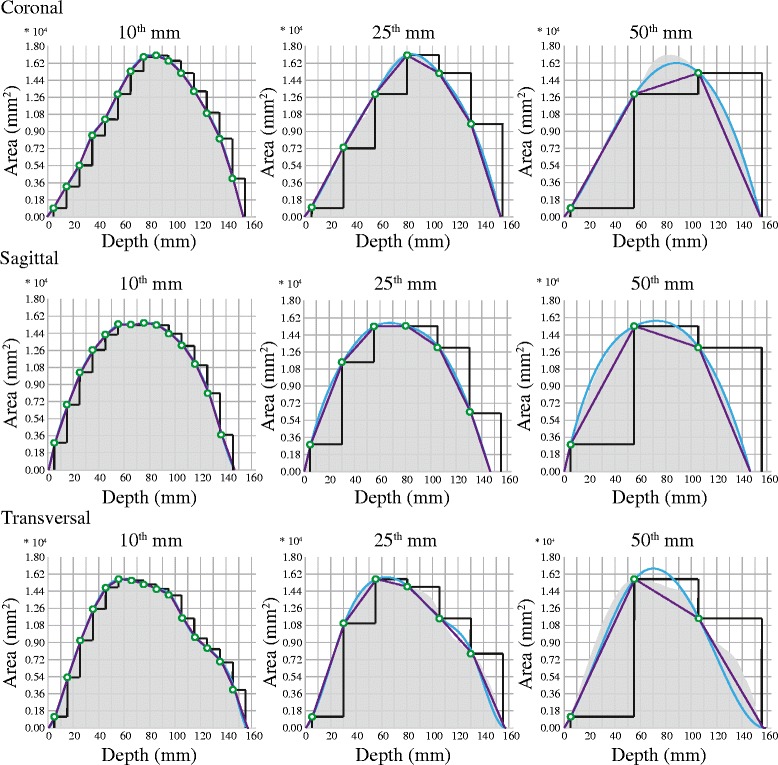
Figure 6.

Estimates of an intracranial volume visualized in comparison to the actual volume. Visualization of a randomly chosen intracranial volume compared to 27 different estimates of this volume. The estimates differ with respect to interpolation method, linear spacing and orientation of the intracranial areas used to calculate the estimates. The gray areas represent the actual volume and the green dots the known intracranial areas (ICA). The estimates are visualized by black graphs (piecewise constant interpolation), purple graphs (piecewise linear interpolation) and blue graphs (cubic spline interpolation). The X-axis describes at what depths the ICAs were measured and the Y-axis the size of the areas. Coronal ICAs are ordered from anterior to posterior and transversal ICAs from superior to inferior. All estimates in the illustration were calculated beginning with the ICA at a depth of 5 mm.
