
Figure 1.
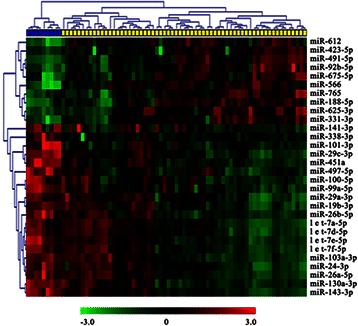
Hierarchical clustering analysis of ICC and NIBD samples with 30-miRNA signature. The 30-miRNA signature was identified from 158 differentially expressed miRNAs between 63 ICCs and nine NIBDs. Heat map representing the expression level of each probe (rows) in the 30-miRNA signature (green color = low, and red color = high) in each sample (columns). The 63 ICCs and nine NIBDs were clustered into two groups by the 30-miRNA signature with 100% accuracy.