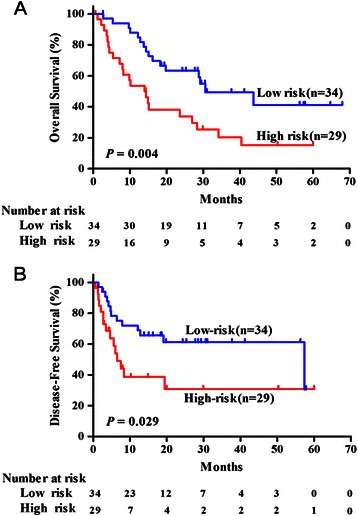
Figure 2.

Survival analysis of ICC patients in high- or low-risk groups. According to the risk score of the 3-miRNA signature, ICC patients were divided into high- and low-risk groups. (A) Kaplan-Meier curve analysis of overall survival (OS) of ICC patients in high- and low-risk groups. (B) Kaplan-Meier curve analysis of disease-free survival (DFS) of ICC patients in high- and low-risk groups.
