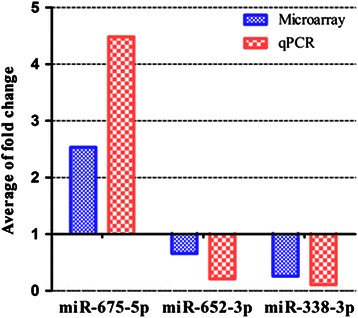
Figure 3.

The expression levels of three miRNAs detected with microarray were verified by qRT-PCR. Histogram plot indicating that the expression levels of three miRNAs (miR-675-5p, miR-652-3p and miR-338-3p) measured by microarray were concordant with those by qRT-PCR, and Spearman correlation analysis showed the high correlations (see the Results section for details) between the expression levels of each miRNA detected by microarray and qRT-PCR.
