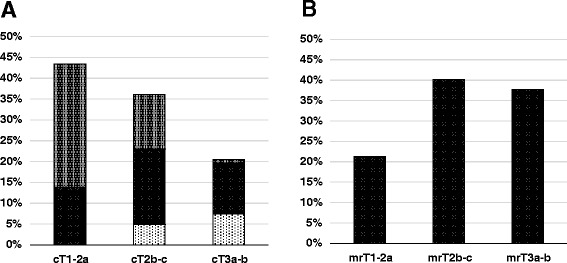
Figure 1.

Distribution of T stage (A) according to CT and DRE and (B) after mpMRI of the prostate. (A) The relative extent of upstaging (grey) und downstaging (light grey) based on mpMRI are shown compared to unchanged T stage (black) for every initial T stage.
