
Figure 2.
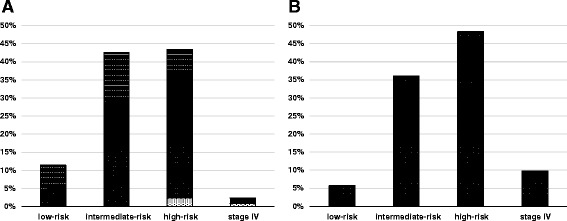
Distribution of overall risk groups based on PSA, Gleason score and (A) T stage determined by CT and DRE compared to (B) T stage assessed by mpMRI. (A) The relative extent of risk group upshift (grey) und downshift (light grey) due to mpMRI-based T stage changes are shown for every initial risk group compared to patients without risk group shift (black).