
Figure 3.
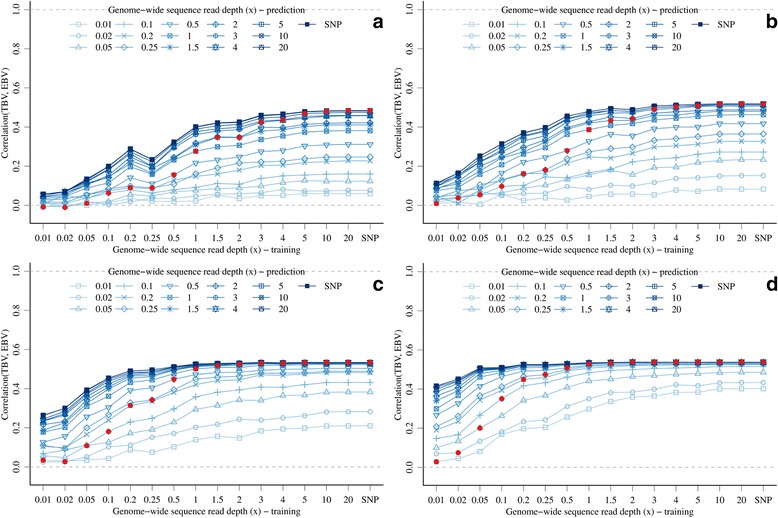
Accuracy of genomic prediction with GBS data with different genome-wide sequence read depths or SNP array data in training and prediction sets (full red circles show points with equal genome-wide sequence read depth) and different marker densities (a) 3 K top-left, (b) 10 K, top-right, (c) 60 K bottom-left, and (d) 300 K bottom-right.