
Figure 5.
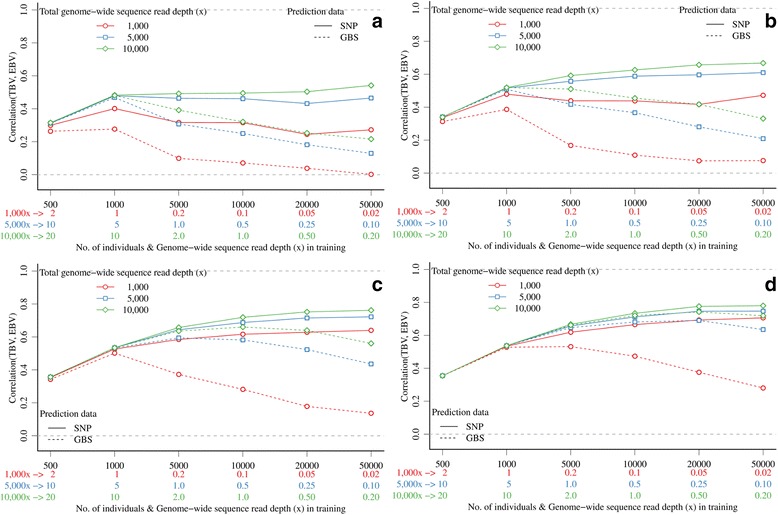
Accuracy of genomic prediction with GBS data in the expanding training set and SNP array data (solid lines) or GBS data (dashed lines) in the prediction set and different marker densities (a) 3 K top-left, (b) 10 K, top-right, (c) 60 K bottom-left, and (d) 300 K bottom-right.