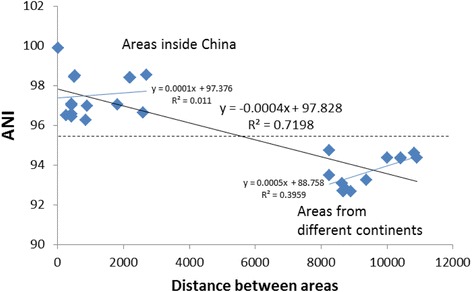
Figure 3.

Distance decay analysis using ANIs among C. testosteroni strains from different areas. The x axis is the distance between different areas calculated by latitude and longitude (Additional file 1: Table S1). The y axis is the ANI between the pairs of strains isolated from different areas. Linear regressions were taken between the ANIs and distances, and the R squares were given. The dotted line separates the ANI-distance relations among areas inside China (above) and those among areas from different continents.
