Figure 1.

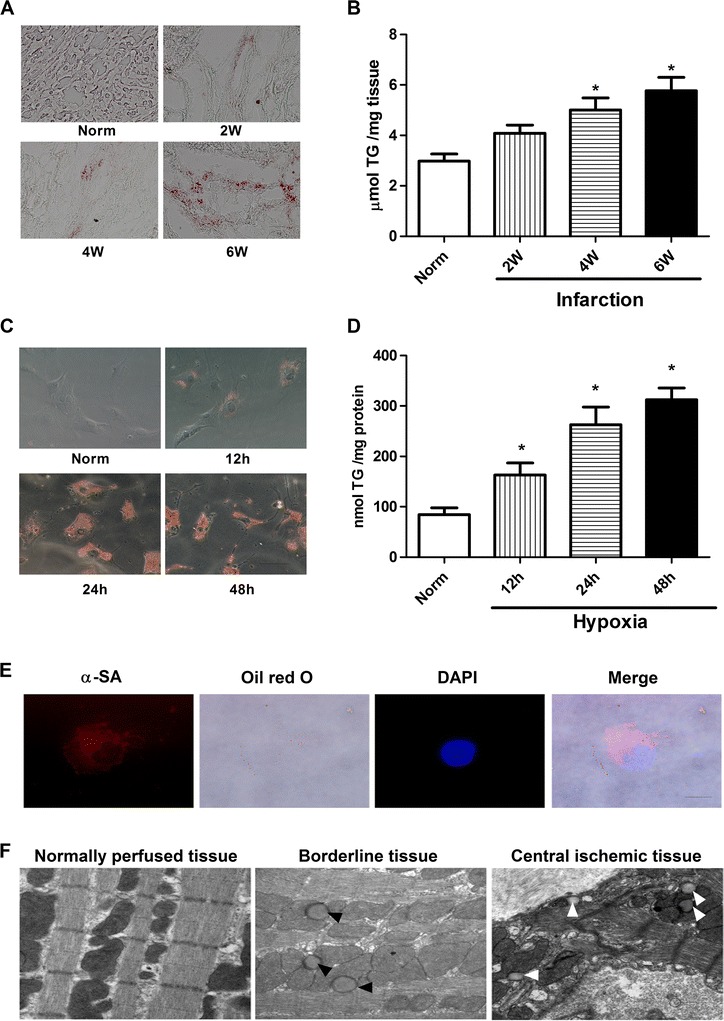
Accumulation of neutral lipids in heart of infarcted rat and hypoxia cardiomyocytes. A: lipid accumulation in the ventricular muscle from rat 2, 4, and 6 weeks after an experimentally induced myocardial infarction, as shown by oil red O staining (red). B: the TG content in hearts from rat 2, 4, and 6 weeks after an experimentally induced myocardial infarction. Values are means ± SD of at least 3 hearts. *P < 0.05 compared the normal group. Scale bar, 40 μm. C: lipid accumulation in cardiomyocytes incubated in normoxia condition or hypoxia conditions for 12, 24 and 48 hours. D: TG content in cardiomyocytes incubated in normoxia condition or hypoxia conditions for 12, 24 and 48 hours. n = 4, Values are means ± SD. *P < 0.05 compared with normal group. Scale bar, 20 μm. E: oil red O-positive cells were found to be α-sarcomeric actin positive myocytes. Nucleuses were stained with DAPI (blue). Scale bar, 10 μm. F: representative electron microscopic views of the normally perfused tissue, borderline tissue and central ischemic tissue from the left ventricular 4 weeks after myocardial infarct induction. Lipid droplets (arrowheads) are present in borderline and central ischemic tissue. All experiments were carried out three times. Scale bar, 500 nm.
