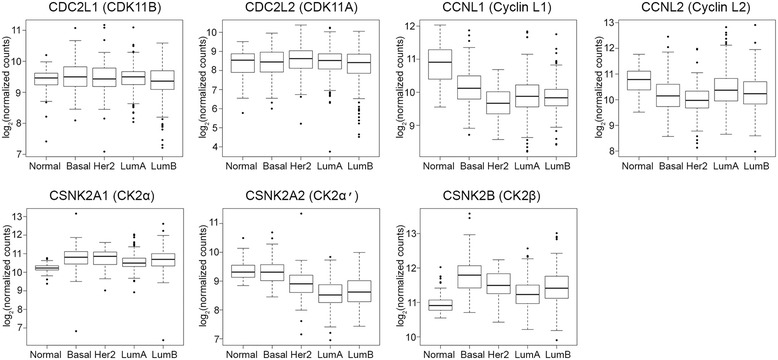
Figure 2.

RNA expression levels in normal breast and breast cancer subtypes. Normalized RNAseq read count data for PAM50 breast cancer subtypes and normal breast from The Cancer Genome Atlas were analyzed for CDK11 and CK2 protein complex genes as shown above each plot. Box, first to third (Q1 to Q3) quartiles; line inside box, median; whiskers, 1.5 maximum interquartile range. Normal, n = 95; basal, n = 141; Her2, n = 67; LumA, n = 421; LumB, n = 192. CDK, cyclin-dependent kinase; CK2, casein kinase 2; Her2, human epidermal growth factor receptor 2; LumA, luminal A; LumB, luminal B.
